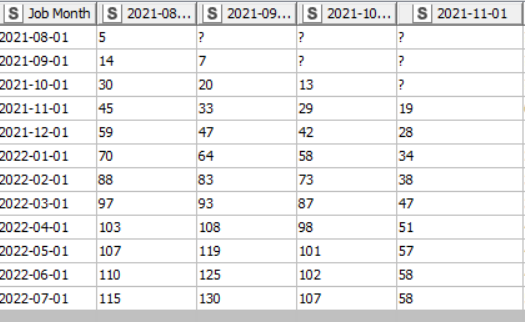
I have the following table;
The first column is job month and the rest of the columns are the respective manufactured date of a product. The output I need is to remove the job month column and use it to find the number of products have called for jobs within 0 months after production, 1 month after production and so on,
@kanishka271 maybe you could provide us with a full set of data and an example of what the result should look like - covering all the options that might occur?
@kanishka271 it is different from your first screenshot or are the column names like “2021/08+Unique count*(Service Order ID)” relevant or is it some sort of aggregation. Maybe you could explain the original data and what would be the logic to come to the other results.
Also what is the time reference? Is it relative to the “Job Month”?
It is aggregated, so the job month is an appliances’ service date and the columns are the manufactured date of those appliances. the logic to come to those results was if it has done a service on the same month of the manufactured month it goes in to the first row, if it has done the service 1 month after the manufactured month it goes to the next row and so on. (please ignore the 2nd screenshots’ row names it is not years it should be months) Hope this makes sense.