Hi Folks,
I am currently trying to build myself a workflow to analize a machine time series.
I get a large (usually 5 didgit) set of data with a timestamp and several measurements.
In there there are several “sections” with a ramp up at the start, a short intersection with no production (the pause can vary in length and timestamp, so no fixed row counter to be used), then several stationary production sections (for simplicity there is only 1 in the example) and a final section with a ramp down.
For simplicity I only added one data column, there are many.
What I already did:
- cut off zero rows from start and end which usually occur
- normalized the time (set 0 seconds at start, I get data every 10s).
What I did not manage:
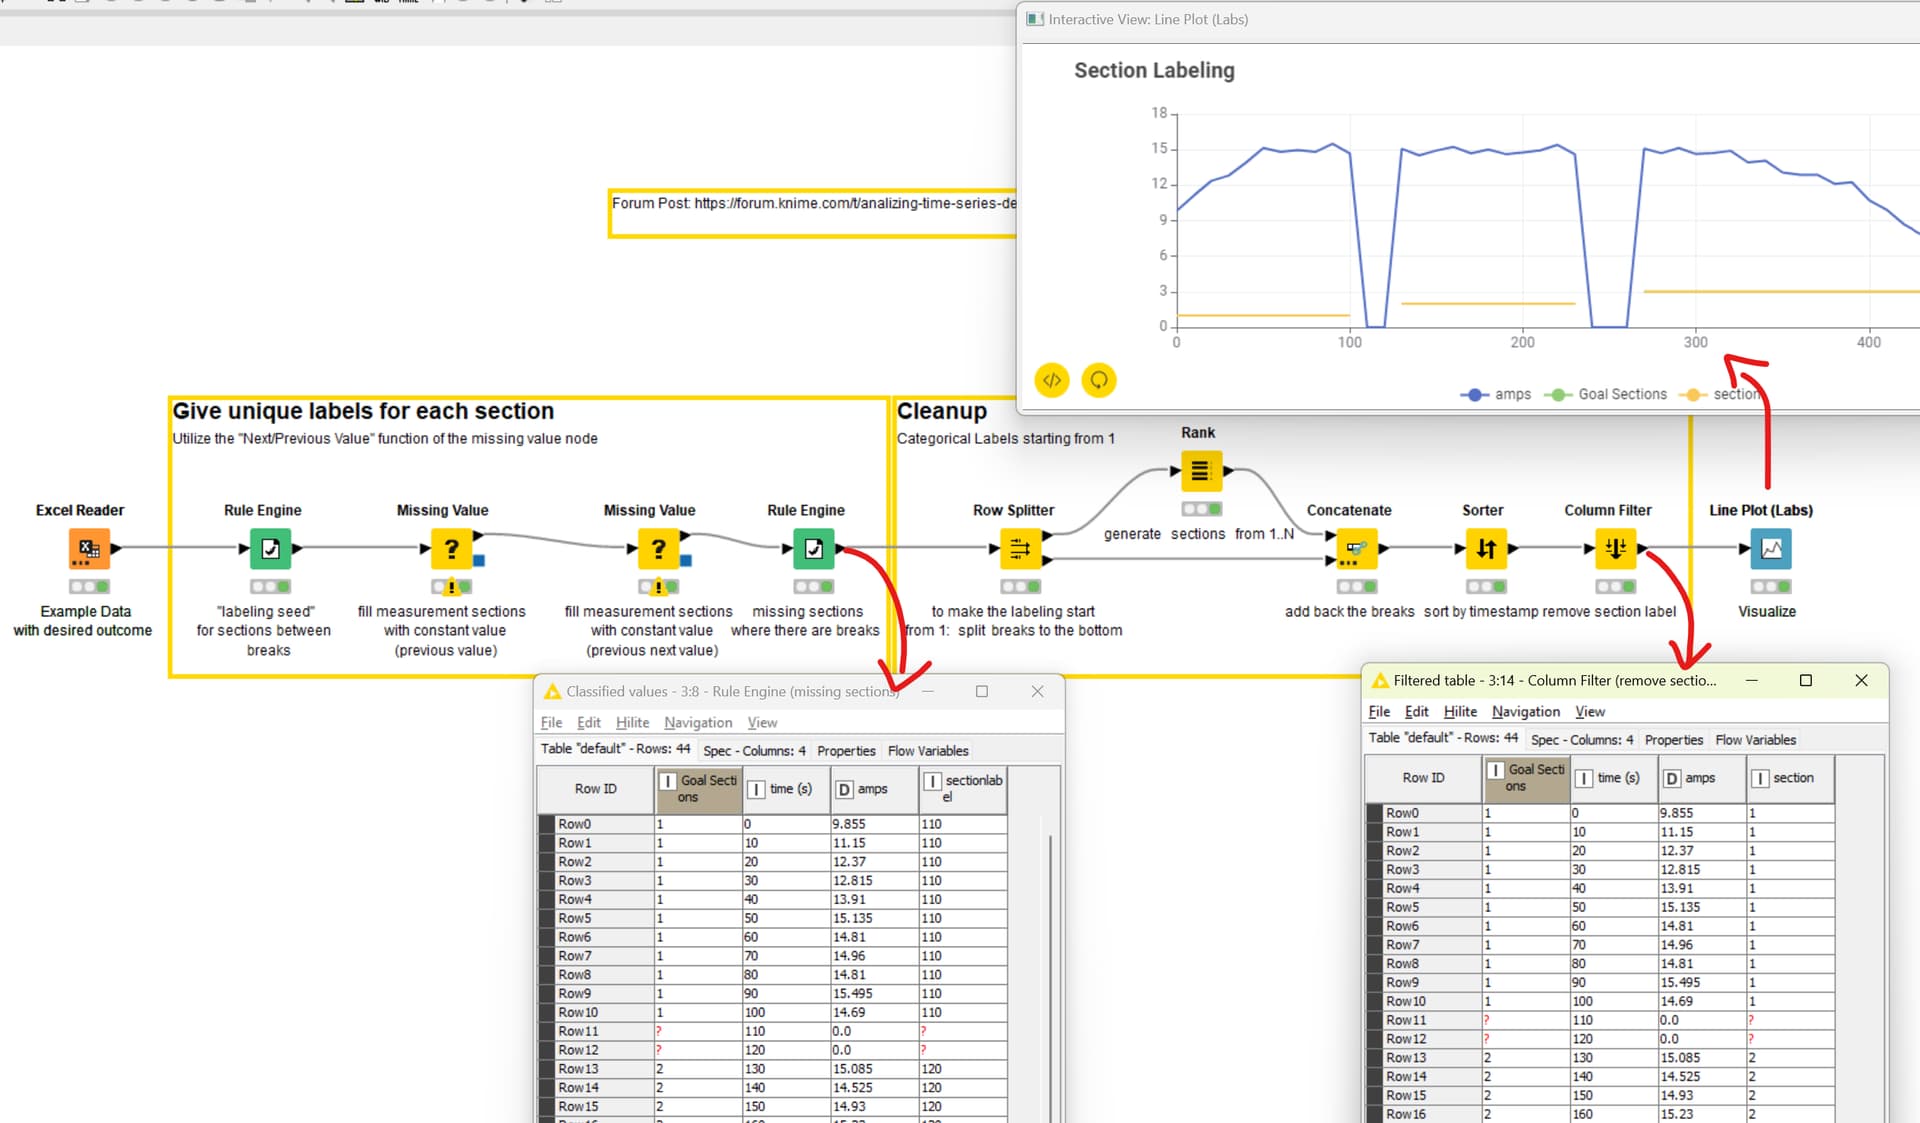
- “cut” the sections and give them a categorial number, aka first section with ramp up as 1, the next with 2,… so I can split data and/or compare them, plot them…you get it. (see example with section number)
I tried the Lag Column Node to identify the beginning of each section (aka is there a huge increase in amps between two rows which points out the end of the “pause”.
There I am stuck. Can anyone have a look at this and give me a hint on how to do this?
Would be awesome.
Michael
Knime example.xlsx (9.7 KB)