I want to extract features from a signal as the first pic below , I wanna take out slop, min position,as well as max position for it , but first I have to split to some parts(like second pic) because as it’s obvious that it has different features in a cycle time domain.
my questions are:1. how can I split it into some parts in order to find slops, max…for each part and 2.with which nodes can I calculate these features…I’d appreciate it, if u can give me some clues…
diaga|262x287 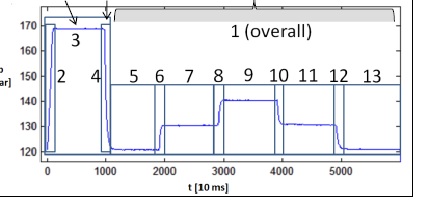
Hi @joan,
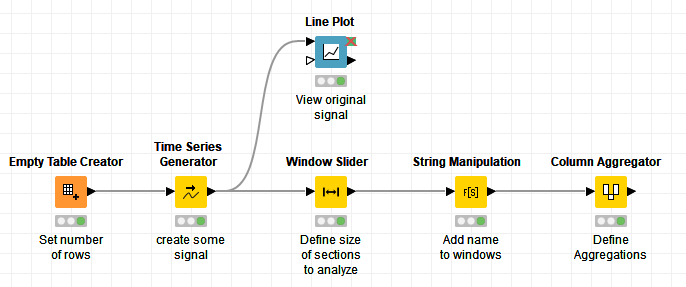
There’s a very useful node called Window Slider, it’s part of a free extension provided by our partner AI Associates.
That node will let you take, for example, chunks of 1000 rows of your signal and flip them into columns.
You can follow that up with the Column Aggregator node to create all the statistics you described on those windows of the data.
I’ve linked a small example to help you get started. Let me know if you have any more questions!
4 Likes
thanks Corey, that was a big help!!!