Anomaly Detection in base/master data with Isolation Forest

Hello dear KNIMEler´s (is this an official term?),

I need your help/feedback/ideads about an approach I´m trying out and am a little bit stuck.

The background
Currently I´m working at an energy utility company and we are supplying water, heat, electricity to around 1 million customers. Therefore we are using some big SAP systems (IS-U) with a lot of data (transactions, customer or billing records, base/master data). One major problem is the data quality (as always) in the base/master data (german: Stammdaten), which will lead further down the road to transaction failures, which will have to be resolved (mostly manually). Any atmend to fix these data before the become a problem has failed. There are already several failsafes integrated, but the processes are changing raptly, the system is integrated with a lot of other systems and we are using external workforce for data inputs.
To put it short, “houston we have a problem”.
The biggest problem is, that incorrect data is not discovered right away, but when several processes are already running and using the wrong data. So when we find the false data we have to turn back these processes, which is quite expensive.

The data
As mentioned, we ware mostly working with SAP systems and about 10 TB of tableau data in around 1000 different tables which interconnections (foreign key) between some of them. The good thing is, that I can probably skin the data and tables to around 2 TB and 50 tables of relevant data, but I´m still talking about millions of rows and around 2500 fields (sap likes to make there tables wide…).

The goal
I want to identify false or incomplete data before it becomes a problem.

The idea
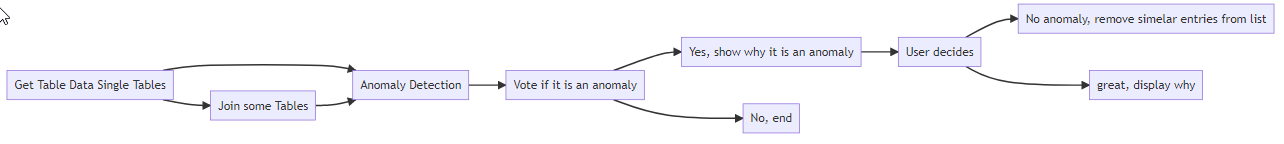
To identify the incorrect data I would like to use a multi level anomaly detection.
That means, on the first level I will just use an anomaly detection algorithm to scan one table at a time to detect the outliners. After that I will connect the table to the other tables with some key´s (there are a lot of possible connections) and do the same thing again. After this I will look at both detection levels and make a vote, if it is an anomaly. Also I have to explain “why” this records is an anomaly.

The problem
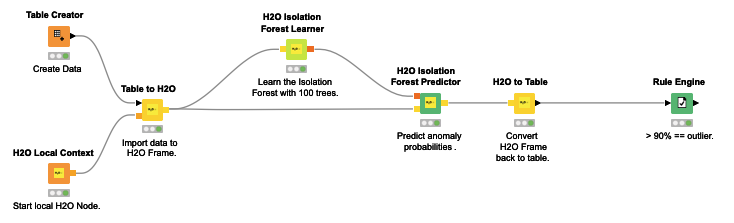
First I had to select a ml algorithm for the detection. Because I don’t know where the anomalies are, I can’t use an supervised learning approach. Therefore I was looking at my data and because of lot of data is categorical and I wish to explain why the data point is an anomaly I chose an unsupervised learning approach. Because of the high degree of categorically data I had the rule out clustering (eg. DBSCAN) and went with an decision tree approach (Isolation forest).
“Here comes my first question: is isolation forest the right approach?”
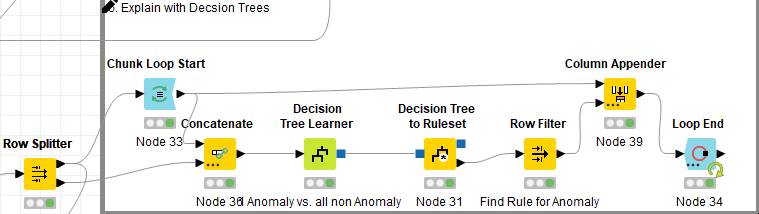
I tried it out and some anomalies were detected, but unfortunately also correct examples. These examples all were special constructs (german: Sonderkonstrukte), which are technical correct but really rare. Because I can’t select these beforehand I was thinking about an “active learning” approach. When I got an anomaly detected, a person will look at it and tell if it is one or not. If it is not, we extract the information why it was detected as that and remove it from the pool with all it similars.
“Here comes my second question: What do you think about this approach and how to I extract the information why it was an anomaly? An isolation forest is basically and ensemble tree approach, so I have maybe hundreds of trees, and they are all voting. Currently I´m using the h2o isolation forest learner/predictor, but I does not give me additional infos or statistics about why it voted that way.”

To put it in a diagramm

Any input or idea is appreciated. Maybe someone has done something simelar?

Thank you all in advance,

Paul

1 Like

Not to spoil the fun of data analytics and machine learning (we might come to that in time) but have you thought about hiring an address cleaning service (I think Deutsche Post offers such things) that might be able to correct the data or help flagging the ones that might be strange (and then you might set up a process of investigation the customers - maybe call them).

Another point might be to install such checks early on in the registration process and maybe incentivise the agents (give them time/money) to enter correct data. I have heard about companies where agents entered wrong information deliberately to prevent other agents from accessing the customers and ‚keeping‘ them for themselves (think signing bonuses and so on).

Having said that and since we are in a KNIME forum you might want to read about KNIME and anomaly detections in several blogs (about isolation forests).

A innovative and exploratory technique I have used is t-SNE where there also is a KNIME solution. There also used to be a Python based solution.

The downside is that this technique is more for exploration and maybe not so much for permanent use but it might give you some new ideas about strange groups you have not thought about before.

Another thing I might think about if you have ‚chains‘ of processes that go wrong (question is what would be an indicator of that) might be to collect missing values from tables further down the line (or very strange numbers). So if a process goes wrong as long as you have a set of consitant IDs you might ‚track‘ that process and see if it produces a lot of missings (since other data might not match or produce correct outcomes).

So it might be interesting to think about some meta information about the data. Number an item has been called/been worked on in contrast to other (similar) items since that might indicate problems / confusion with it.

You should also think about why data would be wrong. Is this just a random occurrence or might there be patters. People being hastened would just enter 0000 or 9999 or xxx in some fields. Or if you think about long form such things might occur later in the process. If you find such ‚telling‘ terms you could check for them or use (KNIME) text similarity search. Would entries in bad data cells be shorter than regular ones?

If you deal with a lot of text you could try text analysis. Are there groups of terms that would typically appear in a ‚good‘ dataset compared to ‚bad‘ ones. You could extract a sample of data where you have done such text analysis transformations and have them marked by experts (like when you detect sentiment) and then build a model that would try and detect new ‚bad‘ ones.

If you actually suspect fraudulent entries you could go down a path of analysing numerical patters - it has been demonstrated that ‚invented‘ numbers show a different pattern than real ones (depending on your subject) - for example the distribution of the last number would be different. I have heard about cases where and analysis based on the person or teams who dealt with the data entry got some results. One team might a pattern where numbers were very evenly distributed compared to all the others - so it could be someone overwhelmingly choose only a few categories in order to be faster. Would there be trend to always choose the first 2-3 items in an entry field?

These are my initial thoughts.

3 Likes

Hi @mlauber71,

first of all thank you very much for your thoughtful and comprehensive answer (and also long at that!).

but have you thought about hiring an address cleaning service

Yes we have, and we are already using some of them for addresses, but this is not the main problem with the anomalies. When I´m talking about base/master data/Stammdaten I´m meaning contracts, metering data, pipes and so on (but maybe base/master data is the wrong English term for that?)
For the other parts there are some companies that offer such services, but in our experience they are quit expensive and don’t work that well (it works better when we can pinpoint the problems and the fix them).

Another point might be to install such checks early on in the registration process and maybe incentivise the agents (give them time/money) to enter correct data

We already using input validation and failsafes where possible, but more often than not this only helps with direct input failures and not with problems further down the line. For example when a customer leaves, the metering device is removed, but when the agent forgets to also cancel the contract in the next billing period (one year later) there is an error. Thats just an basic example and of course we can check for these, but we can’t check every possible mistake.

A innovative and exploratory technique I have used is t-SNE

Looks interesting but only works with numeric data and most of my data is categorical, but I will tug that away for further use!

Another thing I might think about if you have ‚chains‘ of processes that go wrong (question is what would be an indicator of that) might be to collect missing values from tables further down the line (or very strange numbers

That is a great idea and I will try to implement it!

So it might be interesting to think about some meta information about the data. Number an item has been called/been worked on in contrast to other (similar) items since that might indicate problems / confusion with it.

Also great idea and I will look into that.

At the moment my main problem is, that I can’t explain why an isolation forest picks an entry as an anomaly. H2O Knime Isolation forest just says the mean length of all trees and the longer the lenght the higher the probability that it is an anomaly.
I found the following documentation of h2o: h2o-tutorials/tutorials/isolation-forest/interpreting_isolation-forest.ipynb at master · h2oai/h2o-tutorials · GitHub
and it seams what I need is the local interpretabillity. I will try that out and will come back to report!

Have a nice weekend,

Paul

2 Likes

What you can do is convert the strings to numbers. Using One-Hot encoding or some feature hashing or something, That will obviously produce very large (numerical) datasets that also might not be very stable (if additional strings show up), but that would be exactly the point about t-SNE that it can handle such very large numerical datasets.

That indeed is not that easy. There are some approaches using KNIME (one for H2O Isolation Forests).

I do not have much experience with these concepts and their interpretability might need some (well) interpretation in order to really be of any help.

I have a limited experience with H2O „Driverless AI“ (there is also an integration for KNIME for that …) - they have some features that help with interpretation and you can select models according to their „interpretability“. In some tests the models were quite superior - but you will have to see if you would be ready to spend that amount of money. Maybe a test installation might help to decide. Set aside some resources for deployment - when I tested it deploying the results was quite complicated. But as it is often the case KNIME might (now) help with that.

Another approach you could try is explore the area of dimension reduction in order to distill your strings (or key words/parts from strings) into factors and then use them and see which ones come up.

It might very well be that you would need to collect some manually annotated samples in order to train a model with a good target/label.

3 Likes

I haven’t tried this before, but have looked into combining the isolation forest with Global Feature Importance, XAI view or Local Explanation View?

You could run a simple workflow like so:

The rule engine would generate your labels and then you could make surrogate models, and then check Partial Dependence Plot (PDP), Individual Conditional Expectation Plot (ICE), and/or SHapley Additive explanation (SHAP).

Here’s a blog covering all of these topics:

We also have an entire series on guided labeling if that interests you:

4 Likes

Hi together,

thank you both for your work and thought that you put into my question!
I tried quite a few explanation techniques for my workflow.

Shapley seems cool because I can use it directly with my Isolation forest and it tells what variable has which impact on the specific prediction.

The Local Explaination View is a bit tricky and seem to work only with the AutoML-Compontent (or I would have to pack my models like the component does), also it takes some time to get the information. The good think is, it puts out the feature importance + combination of features for the model for the instance, and I can do further things with it.

I also tried XAI, and it works quite well and produces the “Surrogate Decision Trees” for the instances. But it also works only with the AutoML component, is a bit slow. Also it outputs the feature importance, but not in witch constellation it was used.

The last thing i tried was to build decision tree models to explain the anomaly. For this purpose I looped of the anomalies, appended the remaining non-anomalies and build a decision tree. After that I output all the rules of this decision tree and filter for the one with the anomaly.

With that I get the rules, why it should be an anonmaly:

I know this only works when there is no contradiction between anomalies or non-anomalies, but when there is, I will exclude it. These rules help me to build anomaly clusters, explain it to a active labeling user why it was an anomaly and it is kind of fast (but gets slower, when there are a lot of non-anomalies that I have to check against, then I would try row sampling).

Using One-Hot encoding or some feature hashing

I can see One-Hot working, but only on the seperated tables, because I will get really big.
Not feature hashing, because I always believed that these cluster algorithms try to calculate the distance between data points and when I use an artificial order (hashing) it will not work. But maybe I´m wrong and I will try it out and will be back!

Thank you both for you input, I´m much smarter now, than I was before!

Best Regards,

Paul

3 Likes

Hello there,
we are planning soon to provide example workflows on how the XAI components work on a custom model.

We already have those examples for:

Global Feature Importance: Compute and Visualize Global Feature Importance for a Custom Model – KNIME Hub
Fairness Scorer:Fairness Scorer on Custom Model Example – KNIME Hub
Model Simulation View: Model Simulation View Examples – KNIME Hub

We are still missing examples for the XAI View by @Mpattadkal
and for the Local Explanation View by @Corey

Sorry about that.

Maybe, while you wait we make them, you can look at the ones above and get the intuition.
It is not too hard with those capture nodes :slight_smile:

If you do that, let us know what problems you are running into and we will do our best to help you :slight_smile:

You mention something on the surrogate decision tree. For that one feel free to use the Global Feature Importance! First example!

Paolo

1 Like

This topic was automatically closed 7 days after the last reply. New replies are no longer allowed.