ARIMA Examples

I've got a lot of time series data. The actual data is ticket utilization for theater tickets for more adventurous offerings. Based domain experience with this data the utilization of tickets tend to follow adoption / diffusion curves.  

We I'm wondering about using the ARIMA nodes to Model these time series based on 1/2 or 2/3rds of the sales if we will make budget but the time of the curtian.

Unfortunatly there is very little information about the ARIMA nodes.  I've not found an example workflow and little discussion.  Can anyone point me toward that material?

Second, does this seem like a good first attempt to model the success or failture of performance sales?


1 Like

Hi,

I believe the ARIMA nodes should not be too much of mistery provided you are familiar with how ARIMA time series modeling works. If not, this may be a good introductory article:

https://www.analyticsvidhya.com/blog/2015/12/complete-tutorial-time-series-modeling/

If you Google something like "ARIMA time-series analysis" or "ARIMA models" you will find plenty of references, some conceptual some more hands-on. Most of the tutorials you will find are R-based, but it should be rather easy to port them to KNIME. In case feel free to ask again here.

Whether an ARIMA model would be a sensible choice over other techniques to forecast your ticket sales, it largely depends on the nature of your data (e.g. stationarity, seasonanality, noise level, etc.)

ARIMA models are often used for sales forecasting and proved to be pretty rubust, so I would say give it a try and see how well the model performs on historical data before you apply to future projections. Just a caveat. Being this a phenomenon mostly linked to human behavior, past performance may not be indicative of future results.

Cheers,
Marco.

Yeah, I understand about Past Performance and people.

I was just looking at the mechanical points about the usage of the nodes.

When I initally posted I thought that I might need to use the ARIMA Parameter Extractor for example.  I'm guessing not.  I'm guessing that the following series is the right approach.

Data with time and value -> ARIMA Learner -> ARIMA Predictor.

I think I have this setup.  However, I'm stumbeling on the idea of a "Univariate tiem series".  The ARIMA Learner likes my integers in my data, things like Fiscal Years.  However, it is having problems with my actual dates.  


... TIme Passes ...


So I have been playing around with this a bit more.  What I'm not clear about is where the "Time" intervals come from.  Is each line assumed to be an even time interval?  And you give it just the one value you want to predict?


Hi,

few points:

1) ARIMA assumes the time intervals between samples to be equally spaced. As a matter of fact there is no notion in the model of what the actual time intervals are (a second? a minute? a year?) or even that the samples are somehow linked to time in the physical sense. ARIMA models are often applied to modeling/predicting series which in fact have nothing to do with time.

2) Univariate means there is only one variable to consider for modeling and prediction opposite to multiple ones. For example, you cannot use traditional ARIMA to model/predict a series of geographical positions expressed by Latitude/Longitude because that would require working with two variables at the same time.

ARIMAX is an extension of ARIMA which includes regression terms and can be used to address multi-variate cases.

3) As said before, the whole idea behind ARIMA models is that you can predict the next values a variable X will take solely by looking at its previous values, more specifically a combination of them.

In KNIME all you need to train an ARIMA Learner node is a table with 1 column, containing the time series of the number of tickets sold each day. You can try different sets of parameters to see which one better fits your data. There are transformations you can apply to de-trend your data (in case they are non-stationary) or take into account their seasonality.

Back to the input, if on a specific day you didn't sell any ticket, that day will be a 0. If you sell tickets only on MON to FRI but not on SAT and SUN it doesn't matter because there is no notion of weekdays in the time series. In other words, you don't have to create missing values SAT and SUN because those days do not belong to the phenomenon you are trying to predict. When you interpret the prediction thought you have to remember that SAT and SUN are not included.

Once you have trained the Learner, you can use the ARIMA Predictor to predict the following values in the series. In general, as you predict more and more future values, the uncertainty of the prediction will grow.

If you want to visualize how the model works and play with the amount of predicted values, you can use the ARIMA Visualization node.

Finally the ARIMA Parameter Extractor node can be used to export the model parameters generated by the ARIMA Learner node to a KNIME table, while the ARIMA Parameter Importer node can be used to take the model parameters from a KNIME table (e.g. parameters generated by an R script using, for example, the auto.arima() function) and use them as input to the ARIMA Predictor node.

Hope the explanation wasn't tool lengthy and theoretical. Would you consider sharing your data/workflow to make this more practical?

Cheers,
Marco.
1 Like

Marco,

Your description was not too theoretical at all...  Thank You.

I'm going to include a few images.

The first is the work flow that I'm experimenting with.  Fairly Simple.

Top row is about pulling a performances's worth of data from our POS.  Filtering down to a single performance, and grouping for all orders for a single day.

The second row of that image is about the ARIMA Learner.

After working on this last night, I'm fairly clear that I do not have "Stationary" data.  However, I'm not clear if or how to make the data "Stationary" in order to use ARIMA.  Maybe I can't.  That would be great to learn.

See some examples of the data I'm looking at.

The typical pattern starts with a Subscription "On Sale" spike followed by a "Single Ticket On Sale" spike.  Then a build up of Sales activity to curtian.

We also have a "Late Sales Pattern" shown in a seperate file, and the "initial Sell Out" Pattern.

I don't really have to worry about the initial sell out pattern.  Not clear I can predict the "late sales pattern".  However, I'm intrested in what I might be able to be done with the typical pattern.  If I understand correctly I would have to make the data "Stationary".

A few things to note.  The time period from start of sales to curtian varies by weeks to months.  The gap between Subscription "On Sale" and "Single Ticket On Sale" also varies.

Thoughts?

Hi again,

before attempting any modeling or forecasting, it is always a good idea, like you did, to simply plot the data and see what they look like.

In the case of ARIMA models, stationarity is a requirement for the model to work as expected. In very simple terms, stationarity means that the property of your data (e.g. mean and standard deviation) remain constant over time or, in other words, do not depend on when the observations were recorded. If this doesn't happen, meaning the property of your data depend on when the observations were recorded, then your data are non-stationary.

If you want to model non-stationary series with ARIMA, you first have to make the data stationary (if possible). Since ARIMA tries to predict future values out of previously occurred ones, if the properties of the data change continuously over time, there is no way that ARIMA can "predict" them out of any previous historical behavior because that specific behavior never took place before. I believe this is pretty intuitive to understand. 

By looking at your sort_of_typical_pattern.png plot it is pretty evident that your data are non-stationary. Before using ARIMA on them you have to get rid of the non-stationarity.

Differencing is a way to make data stationary on mean. Instead of using the original series X(t), you replace it with X'(t)=X(t) - X(t-1). This is 1st order differencing. 2nd order or more may be also appropriate depending on the data. This also gives an indication of which order to use for the I portion of the ARIMA (d parameter).

Log transformation is a way to make data stationary on variance. Instead of using the detrended series X(t), you replace it with X'(t) = log(X(t)).

You may have to use both techniques above at the same time.

As a next step I would try to bring your data back to stationary and see how they look like.

If you fancy a hands-on tutorial on the subject (R based, but you can easily reproduce it in KNIME), this seems pretty well written:

http://ucanalytics.com/blogs/step-by-step-graphic-guide-to-forecasting-through-arima-modeling-in-r-manufacturing-case-study-example/

Cheers,
Marco.


1 Like

Marco

So based on my experiments this evening my data is a lot closer to stationary.   Still some sort of peiodicity across the x access.  Log(t) - Log(t-1) approach makes a big difference in the data. If I try to go further with this, Not clear if I need to do log(t) - log(t-2) or Log(t) - Log(t-3)... Or if the approach is Log(t)-Log(t-1)-Log(t-2)-log(t-3)...  In doing this I discovered that the "Lag Collumn" Knime node is very helpful for making this work with an already sorted set of data straight forward.  (This is a lot easier than trying to do this kind of thing with SQL.)  Just have to say which column, How many past values you want and the interval of the previous values.

I also discovered that I am missing a bunch of samples where the seat sales for a particulat time period is 0.  Will have to correct this before moving forward.  

When I get to the other end of the problem.  I'll have to work out how to do the antilog and what one has to do this subtraction of Curent Time from some previous time in order to produce the estimate at the scale of the original values. More fun to come...

Hello.  I am hoping that someone may be able to direct me to some assistance?

My client wishes to do some predictive analysis of product / customer sales over time series, and compared to budget and forecast.

I understand that the ARIMA nodes are fairly new, and I cannot find any examples showing their use, as well as, pre-process steps to apply methods to arrive at "stationarity" by subtracting trend, seasonality by differencing, log transformation, etc.

Would anyone be able to direct me to any example workflows or another potential reference showing implementation and usage for these new nodes?

FYI, I did review the Samples located in "07_Time_Series" folder in examples, but these show other forms of linear regression and Moving Average, but do not perform such functions as prediction for the next n periods, etc.

Any help would be most appreciated.

Hello!

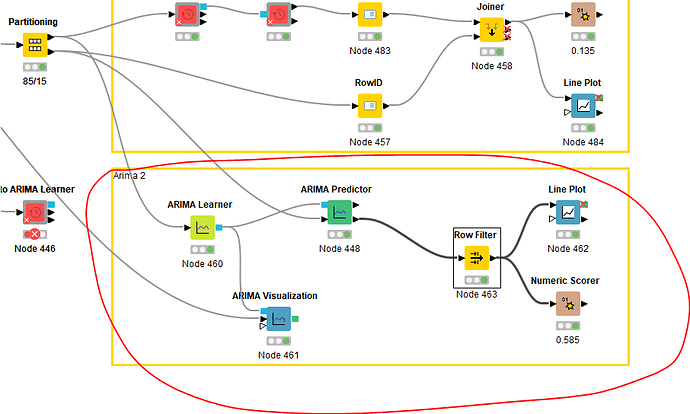
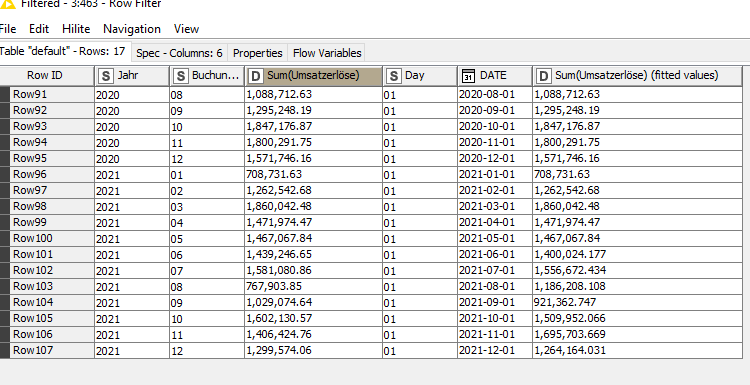
I have a question. I m trying to make a forecast with arima model. I used nodes like at the picture. The Prediction seem to be very good for the years i already have. How can i predict year 2022? Has anyone a solution or some nodes that i have been missing? Thanks a lot!!!