Why does everyone have a KNIME_project3 project? 
I’m still trying to understand what’s the typical scenario, and why we have so much data in the file. Are you forecasting for dates that have already past, or for the future week?
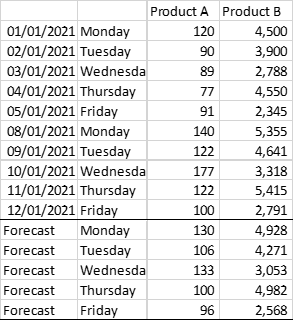
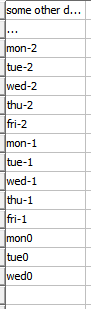
My understanding so far is that, and for the sake of the explanation, I will refer to current week at week0, next (future) week as week1, the last 2 weeks as week-1 (last week) and week-2 (2 weeks ago), and similarly mon-2 means Monday of 2 weeks ago, tue-1 Tuesday of last week, wed0 Wednesday of the current week which is also your current date of running the forecast, and mon1 Monday of next week. Based on this, I’m understanding that you would have this information when you are running the forecast:
And you want to generate data for mon1 to fri1, where:
mon1 = average of mon-1 and mon-2
tue1 = average of tue-1 and tue-2
…
fri1 = average of fri-1 and fri-2
Is that correct?
In a sense, you don’t really care about the data of the current week, correct? You just need the data of (current week -1) and (current week - 2), correct?
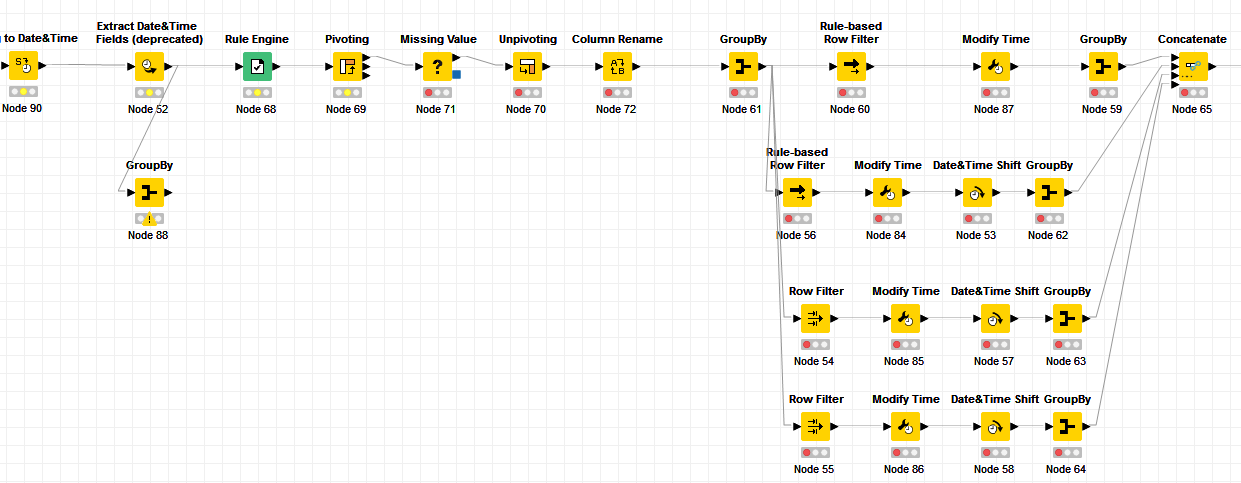
I’m going with the same logic as I came up before:
- Get current week number
- Filter data from 2 weeks ago (last week and the week before last week)
- Extract day of the week
- Average and group by day of week and subproduct
I put something together based on that that looks like this:
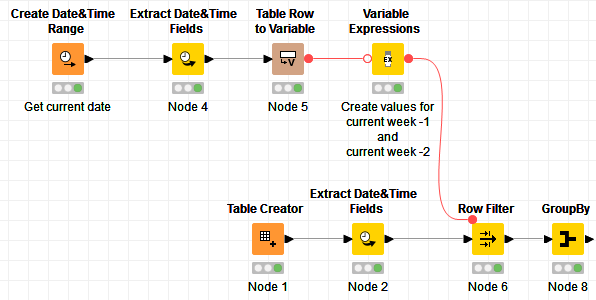
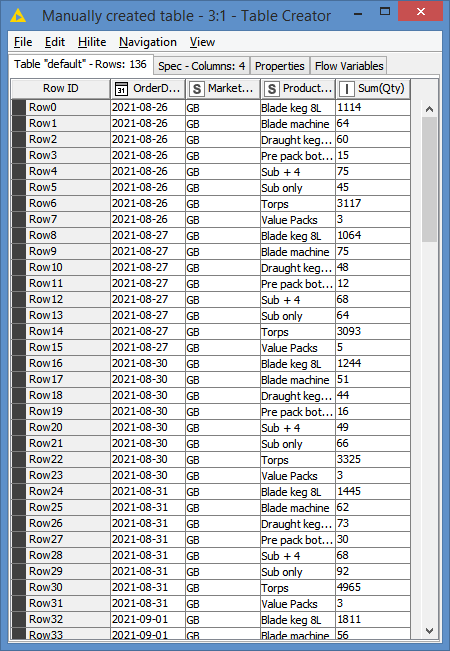
My input data, which is my Node 1 is basically the data that is the results of your Node 65:
One exception is that I added the last column as an Int:
I wanted to avoid having to run all the nodes that you have as I’m running low on memory, but this input table has the same results as your Node 65 has, so it’s essentially starting from Node 65.
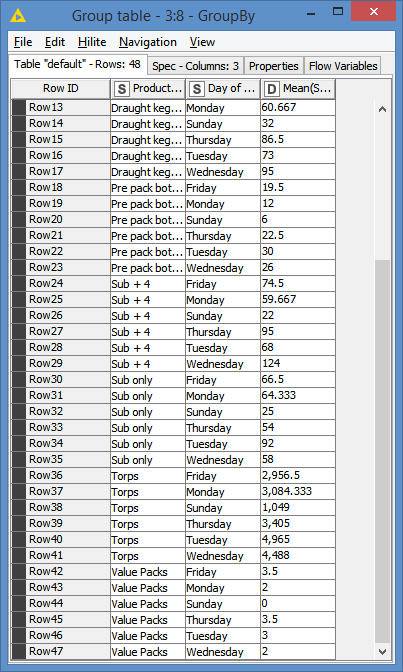
Results of the forecast by subproduct:
We are currently in week 37, so the forecast was done based on data from week 35 and week 36.
After that you can filter out weekends if you don’t want weekends, but there were weekend data in weeks 35 and 36. You probably also might want to round up the numbers, I just did not know what you wanted to do with fractions, but you can figure out that part. I’m just addressing the issue of averaging data per day per subproduct of the last 2 weeks.
Also, it does not matter if you are running this on Wednesdays or any other day. It will just use the data based on (current week -1) and (current week - 2)
Here’s the workflow: Forecast next week data based on last 2 weeks.knwf (24.9 KB)
EDIT: For quick validation, here’s the total average of the last 2 weeks per day if I group by day only in the workflow:
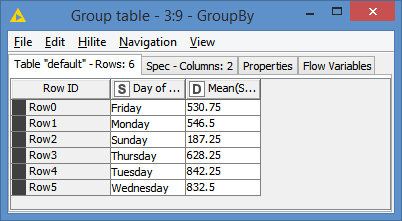
Do they reflect the expected values if you did them manually?