Dear Knimers,
I have two time series (TS), which were uploaded here in the two CSV files (a) and (b):
(a)
MA-SumExps-jan2017-jan2020.csv (1.1 KB)
(b)
MA-SumExps-mai2020-jun2023.csv (1.2 KB)
Indeed, it is a matter of Interrupted Time Series (ITS), as can be deduced from their file names.
I need to demonstrate that the differences in both trends are statistically significant. The angular coefficient of the second is 4.75 times higher than the first.
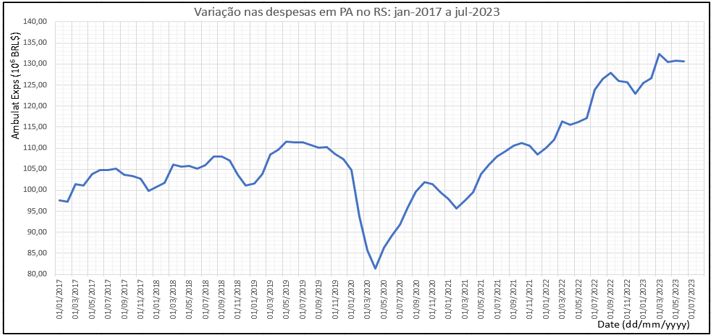
Before splitting the original TS into two parts, I got the following graph (for the whole period):
And after splitting it, I got these two graphs:
- for the period “pre-COVID”
- for the period “post-COVID onset”
I ask for your help with some tasks:
- to (separately) investigate if there is autocorrelation in each TS; and
- to inspect (and if possible, to remove) the seasonality in these two series, but without using resources (e.g., with Knime “Components”) that require Python or R installation.
Can someone help me to accomplish both tasks?
Thanks for all the help received.
B.R.,
Rogério.


