Dear Knimers,
How could I apply OPTICS clustering with a loop (or any other automated path using flow variables) in order to discover the tbest epsilon and min_pts values?
In my research, I am trying to cluster COVID-19 data by grouping cases by municipality and month (each point gathers all new cases in one municipality by month), and already calculated three rates for these points (incidence (of new cases in one month/10,000 inhabitants); % hospitalized amongst cases; % deaths amongst cases), and already normalized ([0, 1] interval). Please read this XLSX attached file:
Munic+yyyyMM for OPTICS clustering.xlsx (220.1 KB)
Now I wished to cluster these data, but don’t know yet how to test (and discover the best pair of parameters epsilon and minimum points using OPTICS algorithm.
Could someone help me with this issue?
Thanks for any help.
B.R.,
Rogério.
Hello @rogerius1st ,
I am not familiar to the OPTICS clustering, I believe the desired WF structure would be something like this:

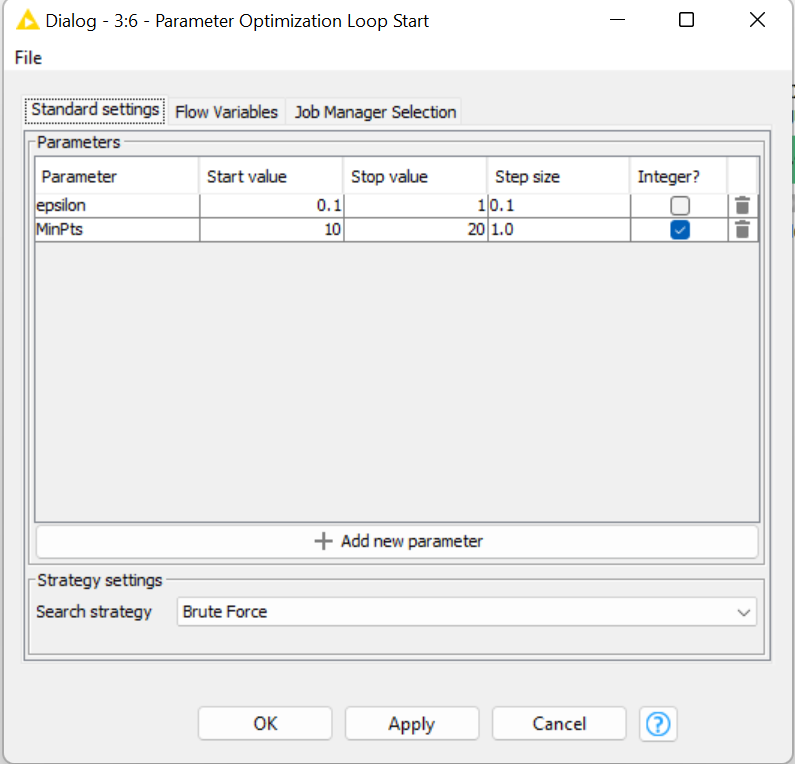
In the Parameter Optimization Loop Start you can define the parameters that you want to fine tuning. (I put dummy data only for the demonstration.)
Finally you can find the best parameters in the Parameter Optimization Loop End dialog (again: it based on dummy data)

Finally in the OPTICS Cluster Assigner you can got the reachability plot, which will then be used to extract the clusters.

Also the output and summary tables:


I hope it helps!
Or if anybody else some other comment please feel free to speak!
Regards,
Dora
2 Likes
This topic was automatically closed 90 days after the last reply. New replies are no longer allowed.