Hi everyone,
Hopefully someone can help me figuring this problem out or has an idea of how to tackle it.
Goal:
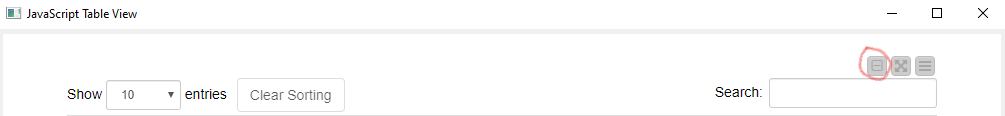
I would like to know if there is a possibility to automatically trigger the “clear selection” button at the top right of a Table View node whenever I’m using an upstream node that re-execute the downstream ones.
Problem statement:
I’m using a Column Filter Widget to exclude some columns from a table. Whenever those columns are chosen (Twinlist for excluding/including columns), then the downstream nodes are executed again. I also have a table and a scatterplot as downstream nodes (in this order), connected together. Whenever I select some data points (that correspond to column names) inside the Scatterplot node, the table gets updated and I can show to the user the points that have been selected.
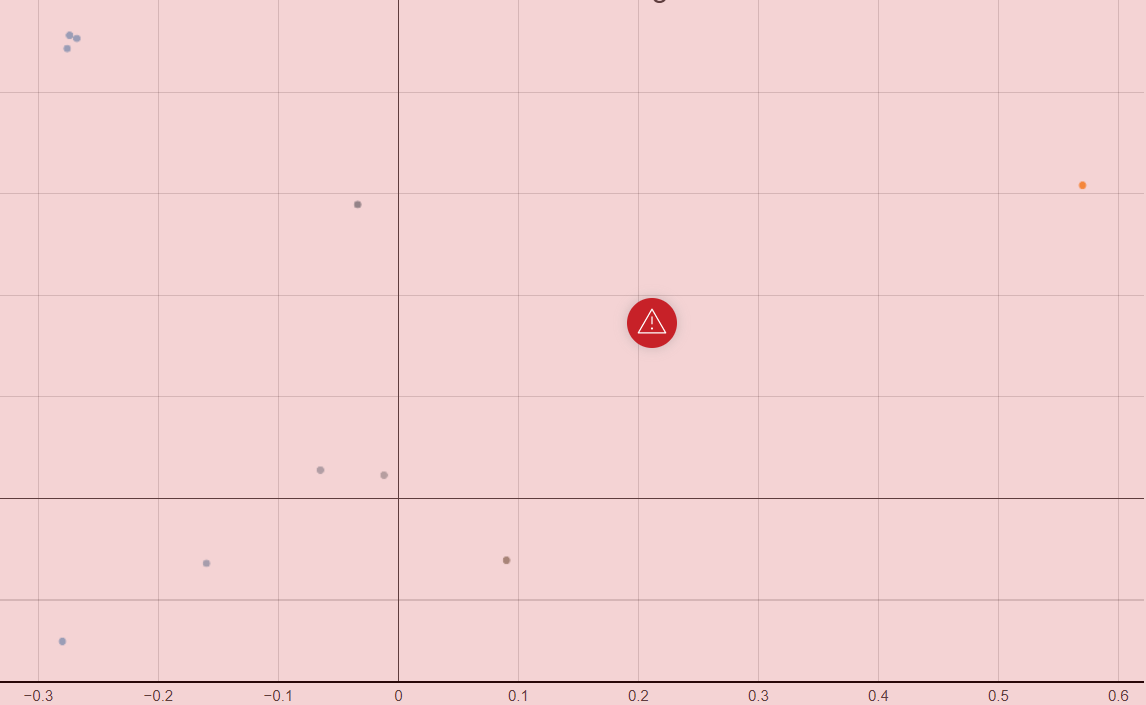
If the user select some data points in the Scatterplot, then I see them selected inside the table; the problem is that if the user exclude specific columns that are also selected inside the table, then I get an error inside the Scatterplot (I suppose, this behaviour happens because, if the points selected inside the table are then excluded using the twinlist, then the Scatter plot gets confused because it cannot retrieve the information from the table; therefore the error).
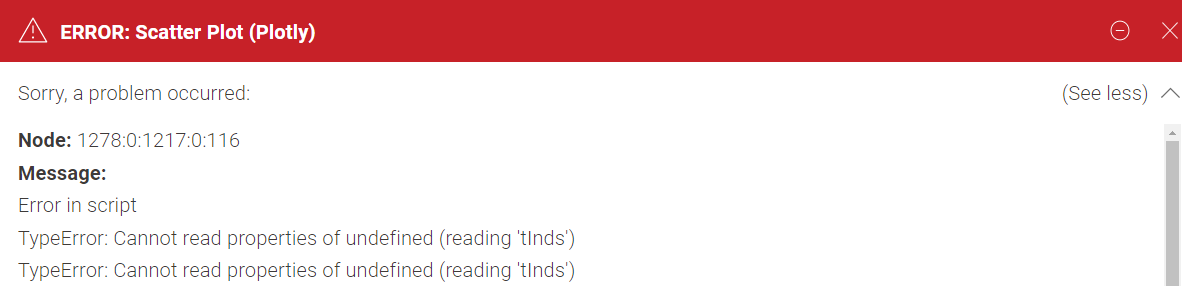
For more information, I get the following error:
TypeError: Cannot read properties of undefined (reading 'tlnds')
thank you for the detailed description. Is it possible for you to share the workflow and a sample dataset? That way it would be a lot easier to try out possible solutions.
Thank you very much for your fast reply!
Unfortunately, I cannot share the entire workflow, but I can try to reproduce the error as soon as possible and be back to you in, hopefully, a few days.
As I said, the problem lies whenever I select some points in the scatter plot (Plotly) or the table (those two are connected together), and I then exclude some values in the table that you can see in the final dashboard, at the bottom, then the scatter plot, I suppose, cannot retrieve the right information.
This is something that does not happen if I change the type of scatter plot with a more basic one (like this one: Scatter Plot – KNIME Hub), but because in the original workflow all of the other plots are done using the Plotly type, I would like/need to use this one.
I hope I was able to explain myself in the correct way, if you need more information just let me know!
I tried adding a Recursive loop node before the Scatter plot and a Recursive loop node after.
My guess is that the recursive node reset the table giving you back the same table but without the points previously selected.
Could it be this the reason behind this behaviour?
thank you very much for the detailed information and the example workflow. I am glad that you found a workaround!
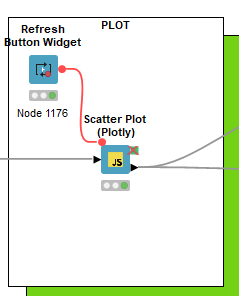
You are correct, the error in the scatter plot occurs because a column that should be displayed in the Scatter Plot is not available anymore. Therefore, some sort of refresh of the Scatter Plot node is necessary. You solved that with the loop. If you don’t want to include a loop you could include a Refresh Button Widget node (https://hub.knime.com/knime/extensions/org.knime.features.js.quickforms/latest/org.knime.js.base.node.widget.reexecution.refresh.RefreshButtonWidgetNodeFactory) just before the Scatter Plot. That way users could refresh the Scatter Plot manually if an error occurs.
Thank you very much for your reply and explanation, you gave me a confirmation of what I was thinking the problem was.
The refresh button is also another possibility! Thanks for the suggestion!