I am pleased to hear that the bar chart will included in the rebuild. It may not be as flashy on the presentation side, but it is often the best tool for intuitive communication to prompt management decisions.
If you are working toward minimum and maximum controls, then please allow us to pass those values to the graph via flow variable. Attempts at “automating” these values based off of the domain will fall short of user requirements because uses, preferences and story telling requirements varies so heavily. (For instance, our charts are often used to represent budget adjustments based on averages. When doing this, great care must be taken to visually display in a way that clearly shows average differences for decision making purposes without setting a min / max that skews a user’s interpretation of those differences.)
I utilize reference lines in all of my reporting. They are a crucial tool for displaying budget vs actual, instant visual feedback of changes applied during user interaction, and visual feedback as to how a change is being applied. Here are some visual examples.
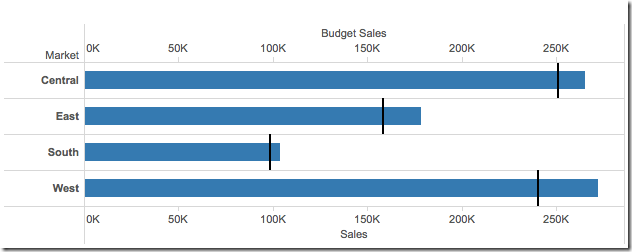
This shows a basic image of a calculated “per bar” reference line that can be used to easily show budget vs actual within an interactive dashboard.
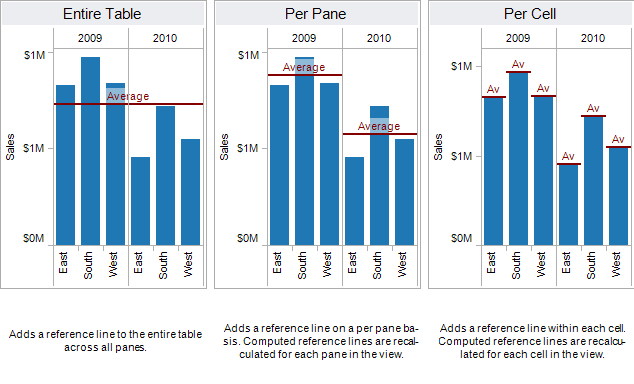
This shows other ways that I utilize reference lines to display different calculation practices. (Ignore the label of “Average” as this is not really a great use case for the need of this capability) Ideally all of these reference line approaches could be utilized, uniquely formatted and overlapped on the same chart, as well as multiple uses of the same type of reference line (aka more than 1 per bar reference line showing 2 different concepts, such as one reference line for budget and another for user proposed changes). A reference line controls should include color, thickness, percent of the bar area, value / labeling and “fill up to line” (this would fill the area up to the reference line with a certain color / transparency either in the background or layered in front of the graph.) The “tooltip” should also be customizable with information from other fields / text.
A strong upgrade of this interactive bar chart would be a massive game changer. It represents an entry point opportunity for me (and potentially thousands of other business users) to fully migrate from Tableau server over to what would become a much simpler and more capable platform of KNIME Business Hub.
In general, I would add that there is far more KNIME revenue potential for exponential growth of Business Hub with a heavier development shift toward highly flexible “business reporting friendly” interactive visualizations and user dashboard interaction control options.
Aggregation: Just wanted to add that I would definitely prioritize enhanced visualization options over “in chart aggregations”. We already have almost infinite possibilities to handle aggregations in the KNIME platforms prior to our chart visualizations. I personally can’t imagine ever using “in chart” aggregation options for review, adjustment and proofing reasons.
Maybe there are a few things that might be user friendly like combined total on a stacked bar chart for value display or something, but I don’t see why we can’t just calculate things like averages and labels first and just feed them through for display in columns. There will always be way more flexibility in the overall platform then anything you can pull off with a single visualization node.