Hello All,
I’m new to Knime, and I’m struggling in finding a way to make a chart that highlights by gender, and by employee work contract (CDD/CDI) their associated percentage,
I would be happy with some ideas !
Many thanks
Hello All,
I’m new to Knime, and I’m struggling in finding a way to make a chart that highlights by gender, and by employee work contract (CDD/CDI) their associated percentage,
I would be happy with some ideas !
Many thanks
You might try this example workflow to see various ways to group, stack, and color bar charts. The trick is usually getting the input data in the correct format.
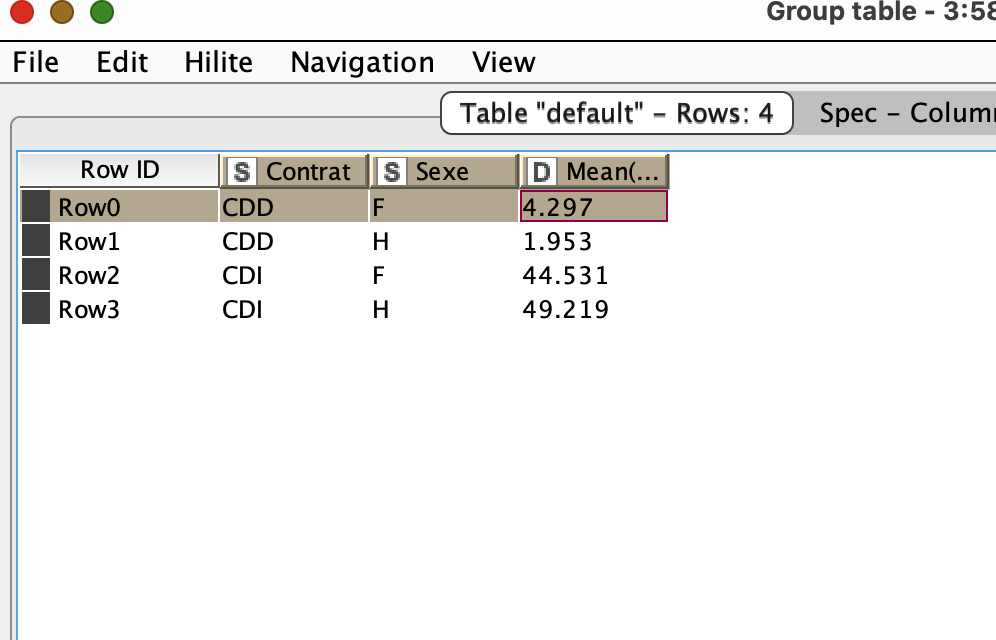
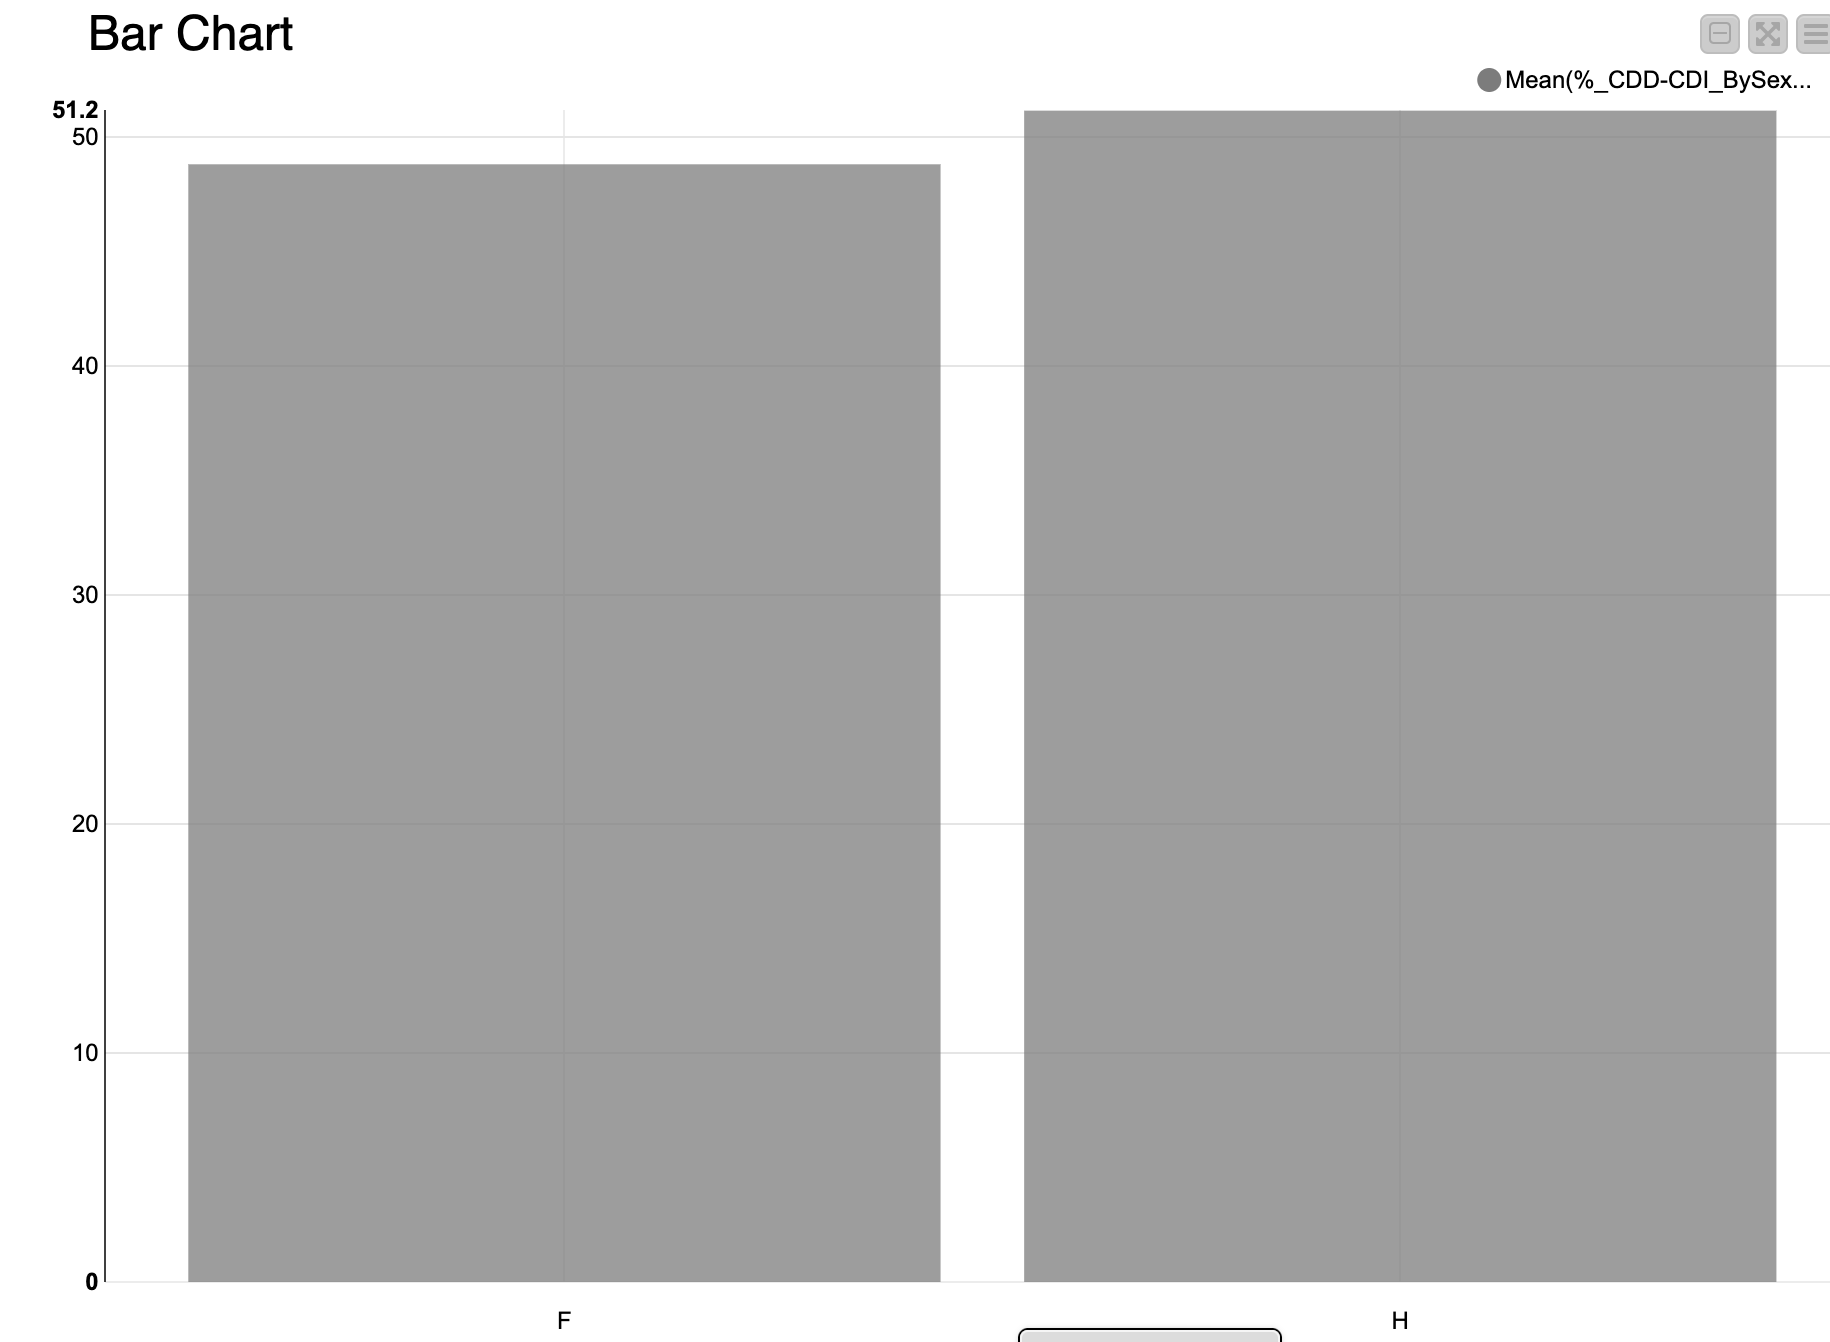
Thank you for reply, I tried to format data as shown but did not get output expected (see image). I’m back to “Groupby” output (as shown previously) with no path in mind to go further…If you have any, thank you to let me know,
Many thanks for your help on this,
@olivier92410 one way to get a lot of flexibility is to use Python graphics with a knime python node or build that into a component.
You could choose from a gallery of matplotlib or seaborn and salt the code.
Most python graphics should work with the new internal Python distribution so you would only have to install the extension and no full python version.
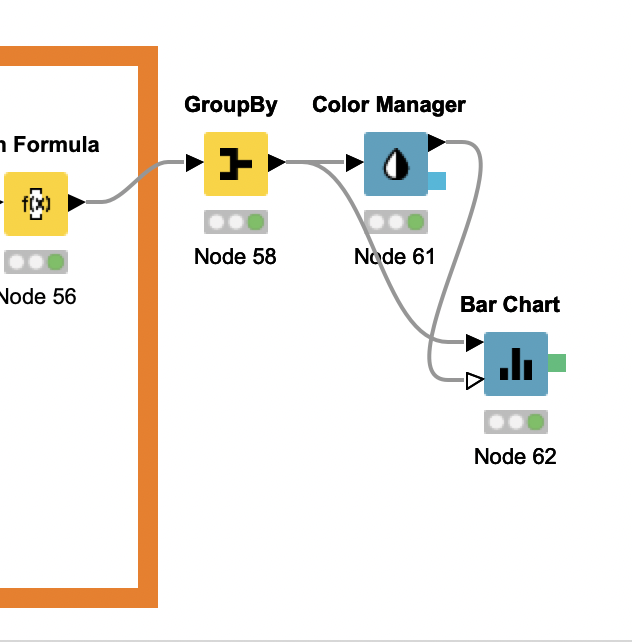
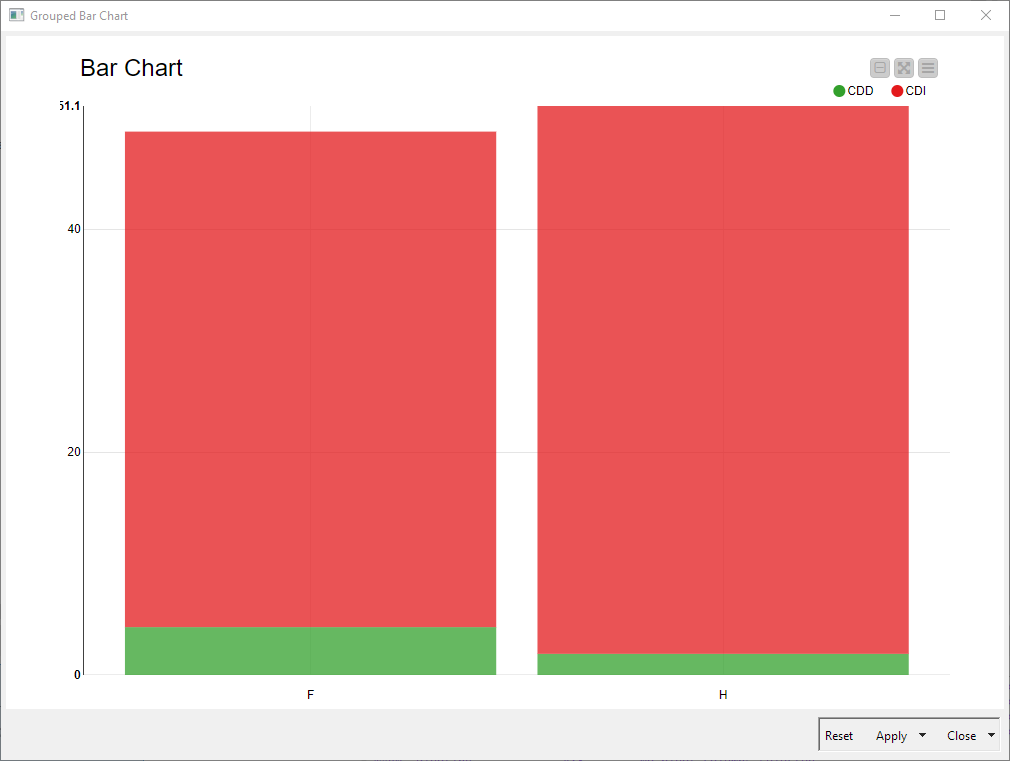
@olivier92410 What about something like this? As I mentioned the key bit is getting the data in the right format so that the Bar Chart node can handle it properly, so I used a Pivoting node to do that. If you don’t need the custom coloring you can ignore the whole bottom branch.
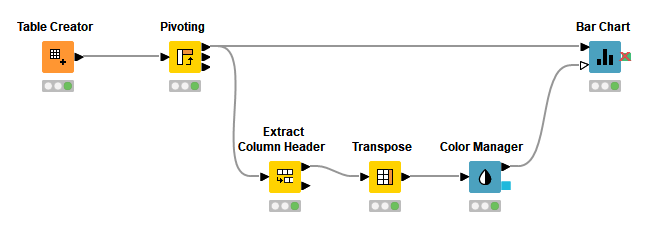
ForumBarChartExample.knwf (15.2 KB)
Many thanks for reply, I started using Python script labs and got what I needed, but I keep your suggestions in mind!
Thank you!
This topic was automatically closed 90 days after the last reply. New replies are no longer allowed.