@GHoertner you could try and indeed use ECharts with Data Apps where you configure just a few things like the columns you want to use, the statistic and then the option to sort by the values.
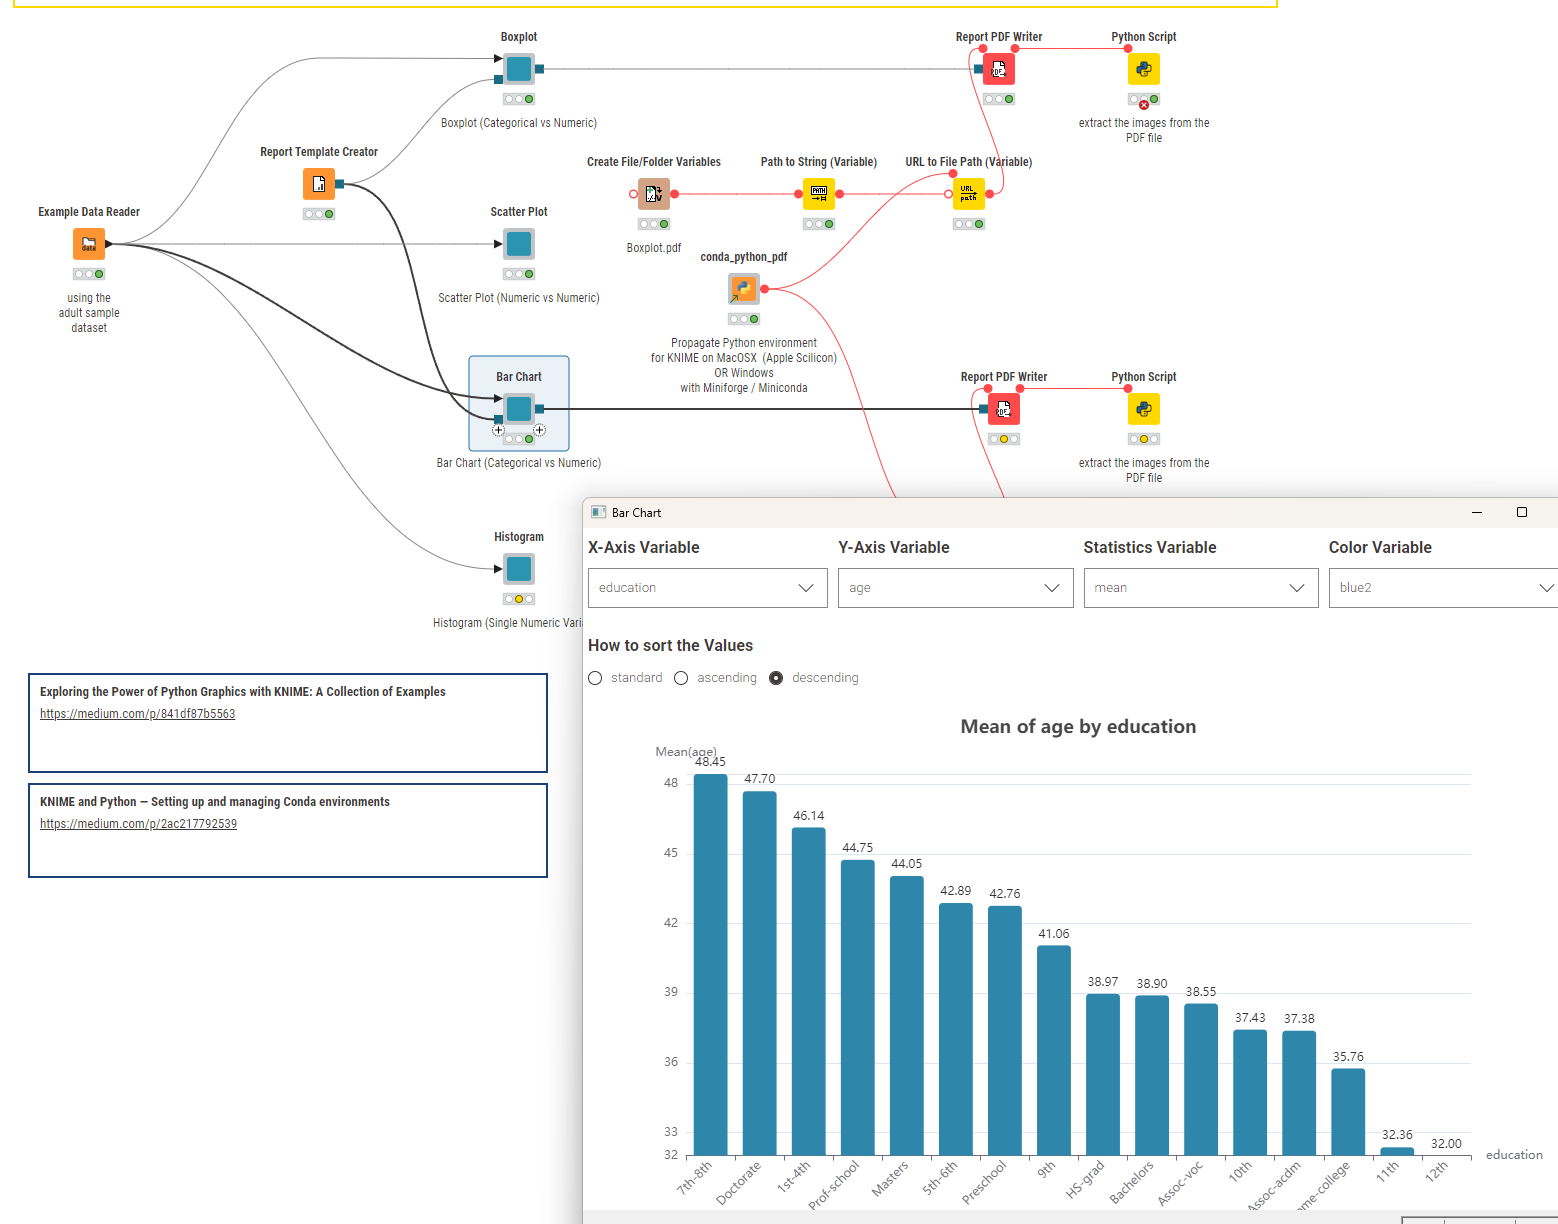
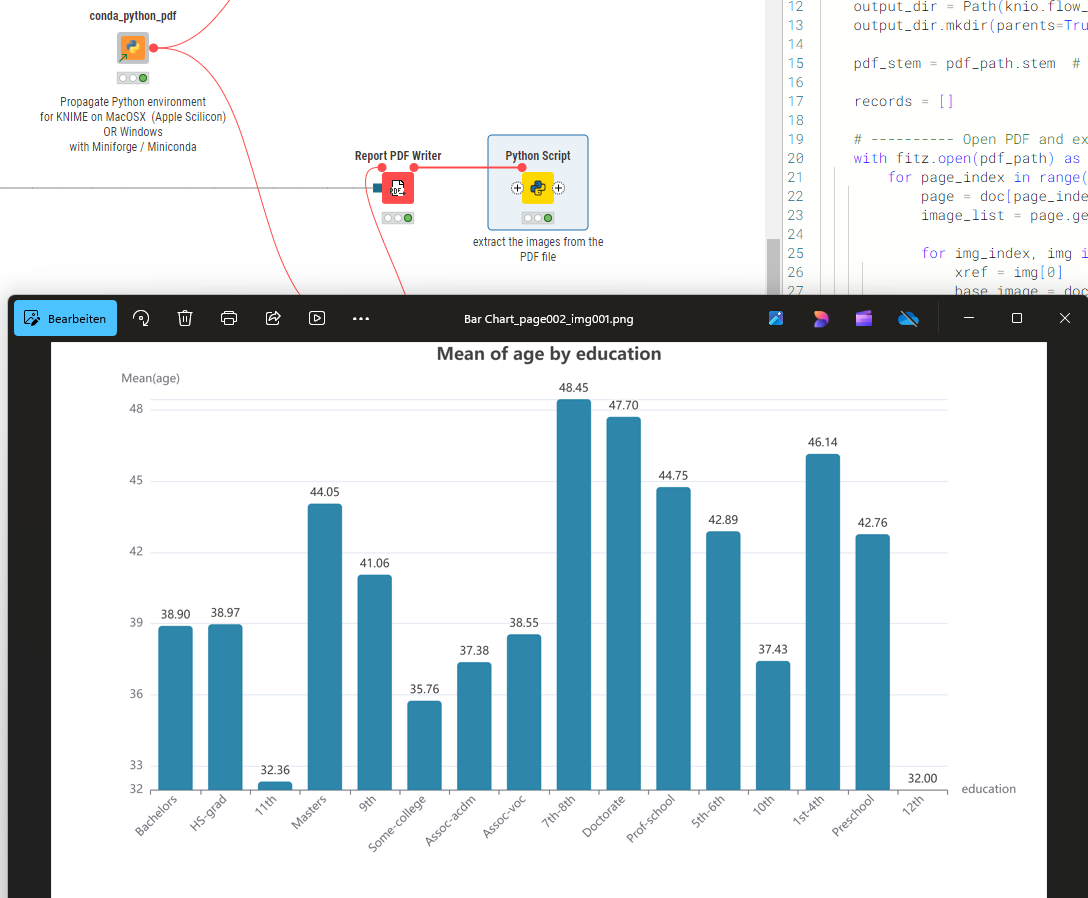
As a benefit I put in a Python node that can then extract an EChart image as a PNG file from the PDF