I have a dataset of 4300 points, quite a few are points that occur in the same coordinates but mapping to OSM doesn’t show more than one at the same location. What are some alternatives that I can do to map these points?
I put together a small example workflow (based on Martin’s original OSM workflow from the Hub) that has a couple of simple ideas. In this workflow, I altered the original dataset to introduce multiple artificial “shipments” to individual cities.
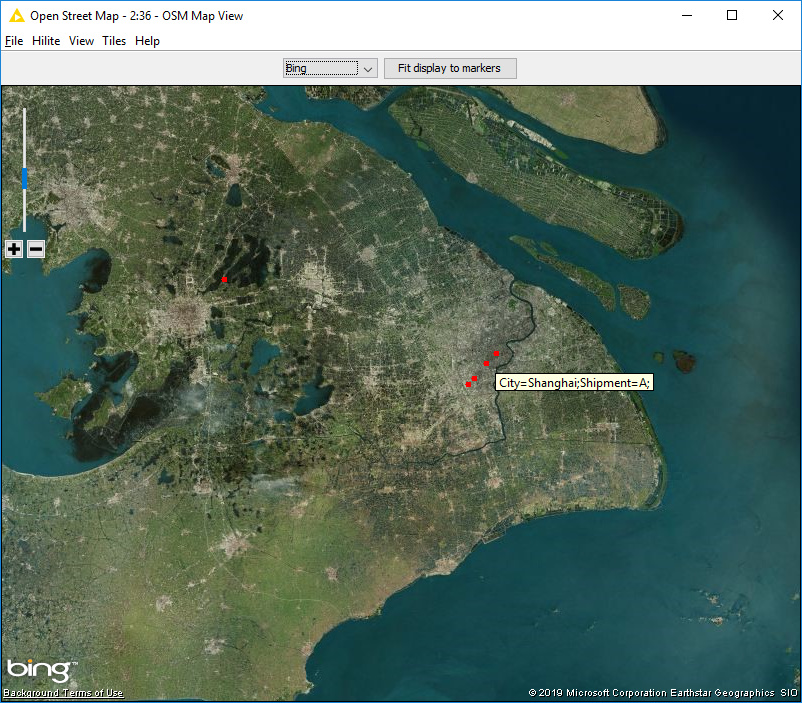
One way to tackle this would be to add “jitter” - slight artificial perturbations in the plotting coordinates - so that they show up a little better. In the workflow, I jittered +/- 0.1, but this can be adjusted depending on scale. All of 4 of these points below represent the city of Shanghai:
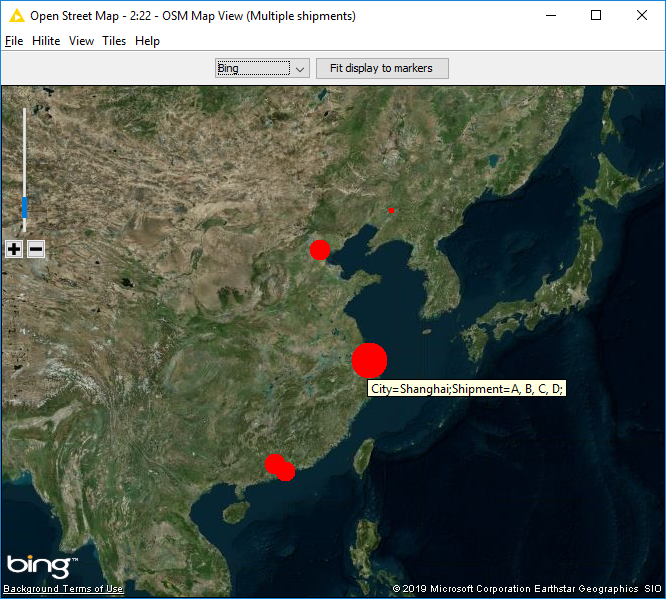
Another idea might be to group by a particular item of interest - in this case my “shipments” with the idea that even though you only see one point plotted, the overlay will display information on the underlying item: