the tables have a date-column that should be used as the x-axis. The values in the corresponding “number”-column should be the heights of the bars in the bar chart
It needs to be flexible: If requirements change, then I should be able to adjust the settings of all bar charts at once, since it will be a lot of work otherwise.
At the moment, the requirement for the date-axis is that the labels appear vertically, so that they don’t overlap with each other
another requirement is that it should be possible to add a line-plot with average values to the chart, averaged over several dates, so that the bars with the recent information can be compared with the averages.
a bonus would be if the line-plots would include information about the variance or standard deviation of the information over which we average
The following does not work (unless you tell me how to make it work):
creating the tables in the report-designer. If I do this, I have to make the settings for 30 tables. Even if I copy and paste, it does not work, since the requirements will change.
So in fact, I think I need to do all the tables directly in the Knime workflow. But so far I did not see any way of doing it. The settings of most ways of creating bar charts don’t seem flexible enough for what we want.
Or you could use the R or Python (matplotlib / seaborn) nodes and a plotting library and create the plots there. Mostly a thing of your personal preference which option you choose.
Main take-away being that such charting is never easy and programming is needed.Settings can come from flow variables that can accordingly be used in the JS/R/Python code.
As beginner pointed out, you can use the Generic JavaScript View node to create your customised bar charts.
Regarding creating a dynamic report, first of all you can create your bar charts in a loop, using the Group Loop Start node to process another group of rows for each iteration. Inside the loop you can create a bar charts for each group table, use Image to Table to convert the generated image to a table cell and Renderer to Image node to convert the image to PNG format with predefined image size. Then the Loop End node will collect the bar charts images from all the iterations and the Data to Report node will make the data available for the KNIME Report Designer.
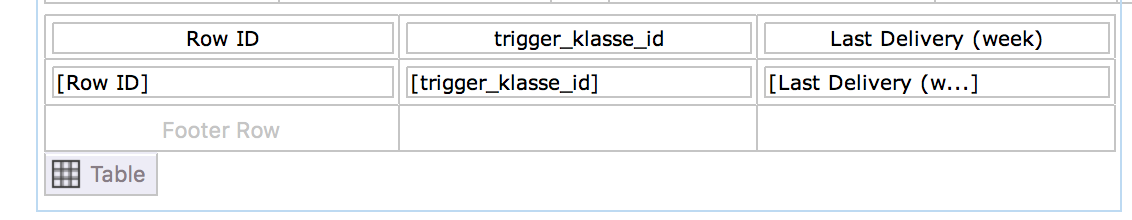
In order to be able to have dynamically changing structure within the report, in the report designer after adding a table to the page and binding it with data, click on the table and click again on a table icon in the lower left corner (see the attached screenshot), choose the Groups tab in the Property Editor (see the attached screenshot) and click the Add button. On the New Group form you will be able to choose a column to group on (could be RowID in your case).
We decided that I do the tables just with the “GroubBy BarChart” node since it has enough options (in fact, we lowered the requirements for this, but that’s okay).
@amartin : My Images are already in PNG Format. Do I still Need the renderer? If I don’t use it, will the size just be some Default size?
Actually, I do not really understand what you write about dynamically changing structures in the Report. We have precisely 36 tables, and the aim is that they are grouped into 9 chunks of 4 tables which are related to each other, and that every page of the Report shows exactly 4 related Charts.
There is no Problem with putting all the 36 Charts into one table, but I have Problems selecting the Charts in the report-designer. Even completely manually, I am not able to do it, since I don’t know how to Access a specific cell-entry (i.e. chart) from my table from the report-designer.
It seems to not work with the “Image”-report-item in the Report designer, since I cannot Access a specific table-cell from there. I posted this specific question also here:
It is correct, you do not need the renderer in this case and the size will be kept (as the image was generated).
What I said before regarding the grouping functionality is exactly what allows you to access the images one by one (please note, it is not possible to manually access the cells of the imported table within the report designer).
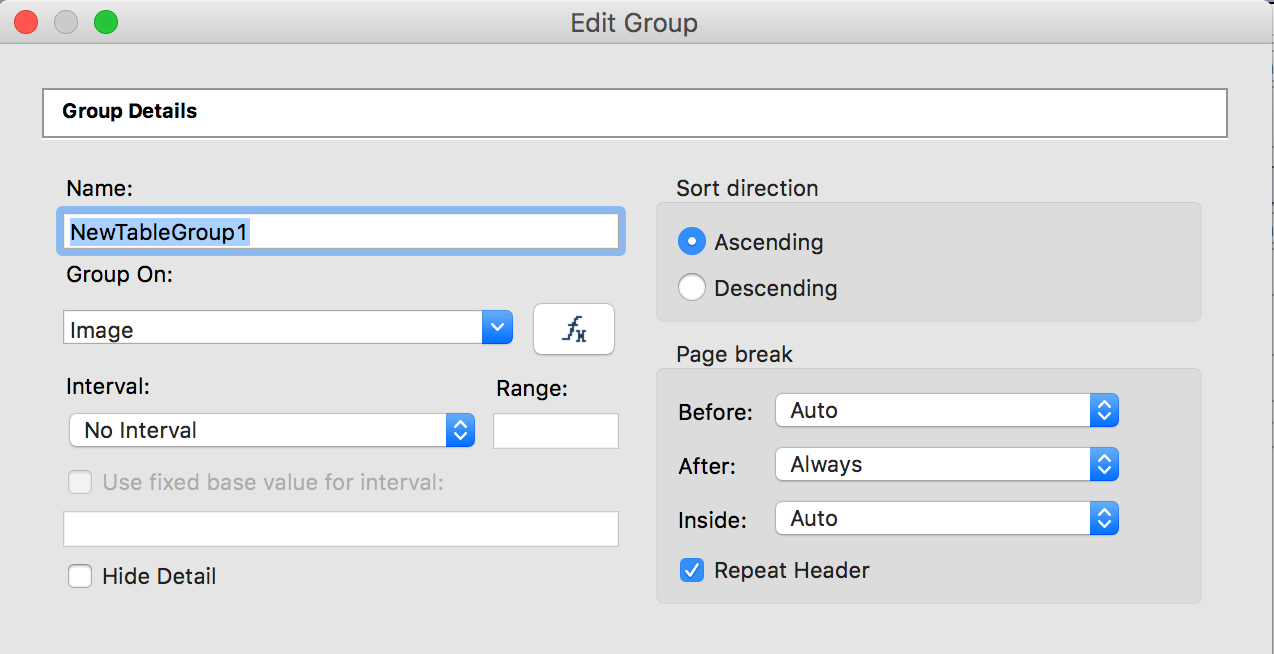
Please find attached workflow, here in the first table I group by image and place all the images to one page (default settings, please see the attached screenshot), in the second table I do the same but put each image on separate page (Page break > After > Always, please see the attached screenshot).
In case you want to group your images differently and put, say, several on one page, you can add a column identifying the grouping before importing the data to report and use this column in the Group On parameter.
Unfortunately, I am unable to use your workflow, since I am at work and anable to install extensions from here. I will try it this evening at home. The Image Reader is missing in my Installation.
When I use a table and bind it with data, the Images are not displayed at all: It says that the data type is “blob” and in the Report, only a string appears. So I actually don’t know how to do it with a table at all. When I directly insert an Image, the Problem does not occur.
maybe I am not so far away from a solution, but it still does not work:
I now changed the original table with the Images and have a table with 4 columns and 9 rows which I send to the Report with a data to Report node. Since - as I said - I seem to be unable to use a table in the report-designer for inserting the Images (because there will only be a string instead of the image) I tried it with the “grid”. This actually works: I Chose a 2*2-grid and put a Picture in every cell of the grid and Chose “Dynamic Image” and then one of the four columns.
Unfortunately, I only get one page in the final Report, but I would like to have 9 pages, all looking the same but using different rows of the table with the Images. Is this possible? Actually, that was what I expected reading “Dynamic image”.