I have two integer columns in my table, mileage & price. I’m using the Interactive Histogram (Local) node. When I specify the mileage as the binning column, it works fine. I get the number of bins specified in the bin settings. However, when I specify the price as the binning column I get 2 bins, even though the number of bins is set to 10.
I cannot figure out why I can’t get a good histogram for the price column.
Hello @buddyjones0 ,
Welcome to the Forum!
Could you please give us a little bit more info to help us finding the solution to your problem? If it is possible could you share a print screen of your WF and / or some dummy data which could represent the nature of your dataset with the aim of being able to reconstruct your WF, also could you show the present settings of your Interactive Histogram (local) node?
Regards,
Dora
Hi @buddyjones0 ,
what you told us with price can happen in this situation:
- You ask for 10 bins with equal width
- Data fall inside just two bins, and all other bins exist but are assigned to no row
You will have just two bins at the end, but you cannot see the other eight you have asked.
This is just an hypothesis that came to my mind; as Dora said, we cannot help you more without an example.
Have a nice day
Raffaello
1 Like
“Thank you” to both of you for your help.
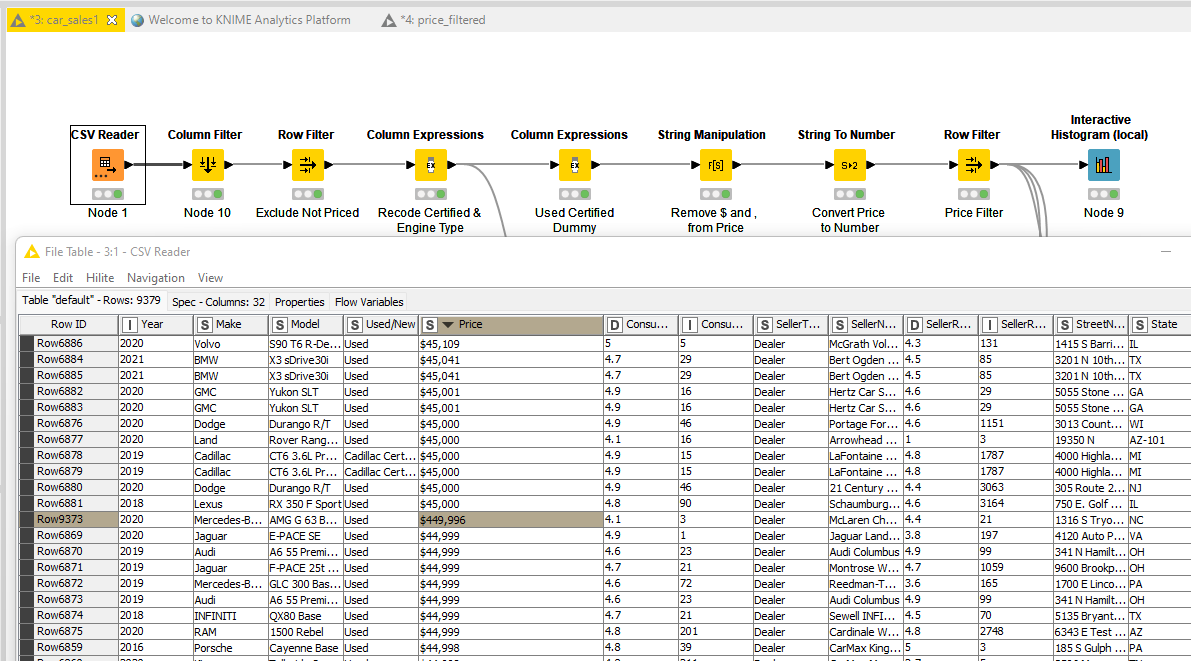
Rafaello is right about what’s causing my result. My source data has 9,379 rows and the maximum value for PRICE is 449,996. I have a ROW FILTER node just before my Local Interactive Histogram, but it is not filtering out the values above 100,000.
-
screen shot 00 shows the source data with 9,379 rows and maximum PRICE value of 449,996
-
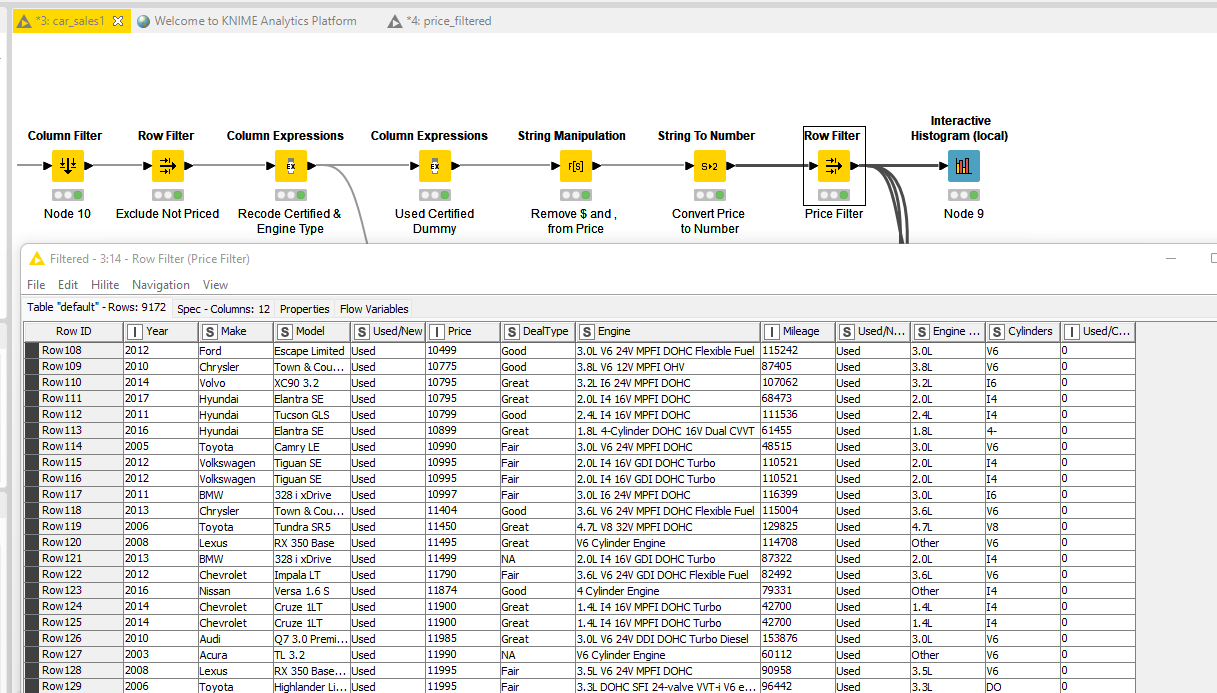
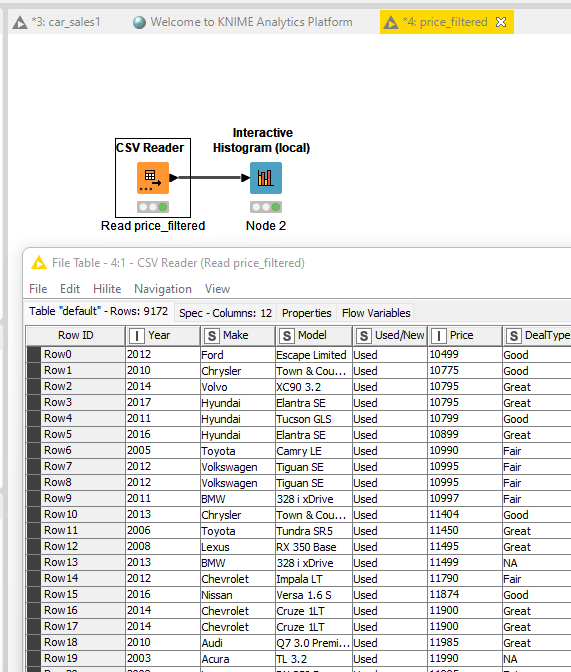
screen shot 01 shows the filtered table with only 9,172 rows after filtering only values between 10,000 and 100,000
-
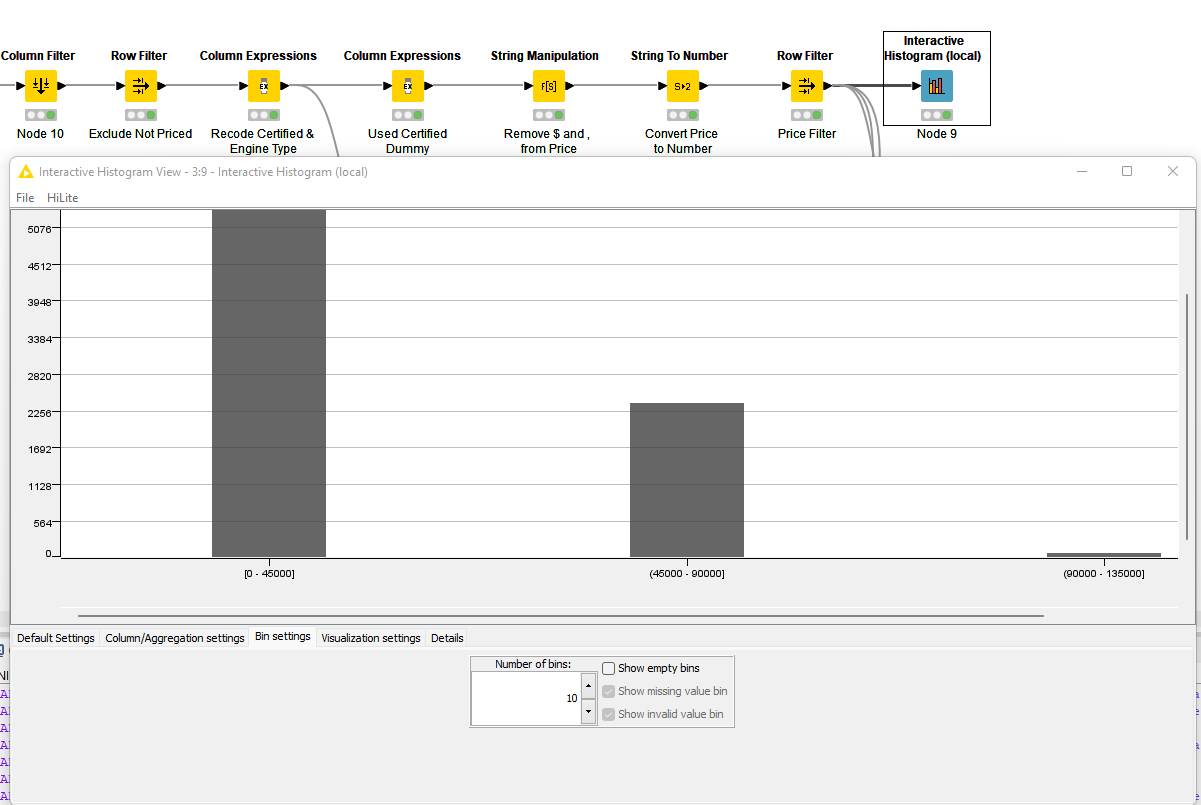
screen shot 1 shows the initial histogram with only 3 bins ( “Show empty bins” not checked)
-
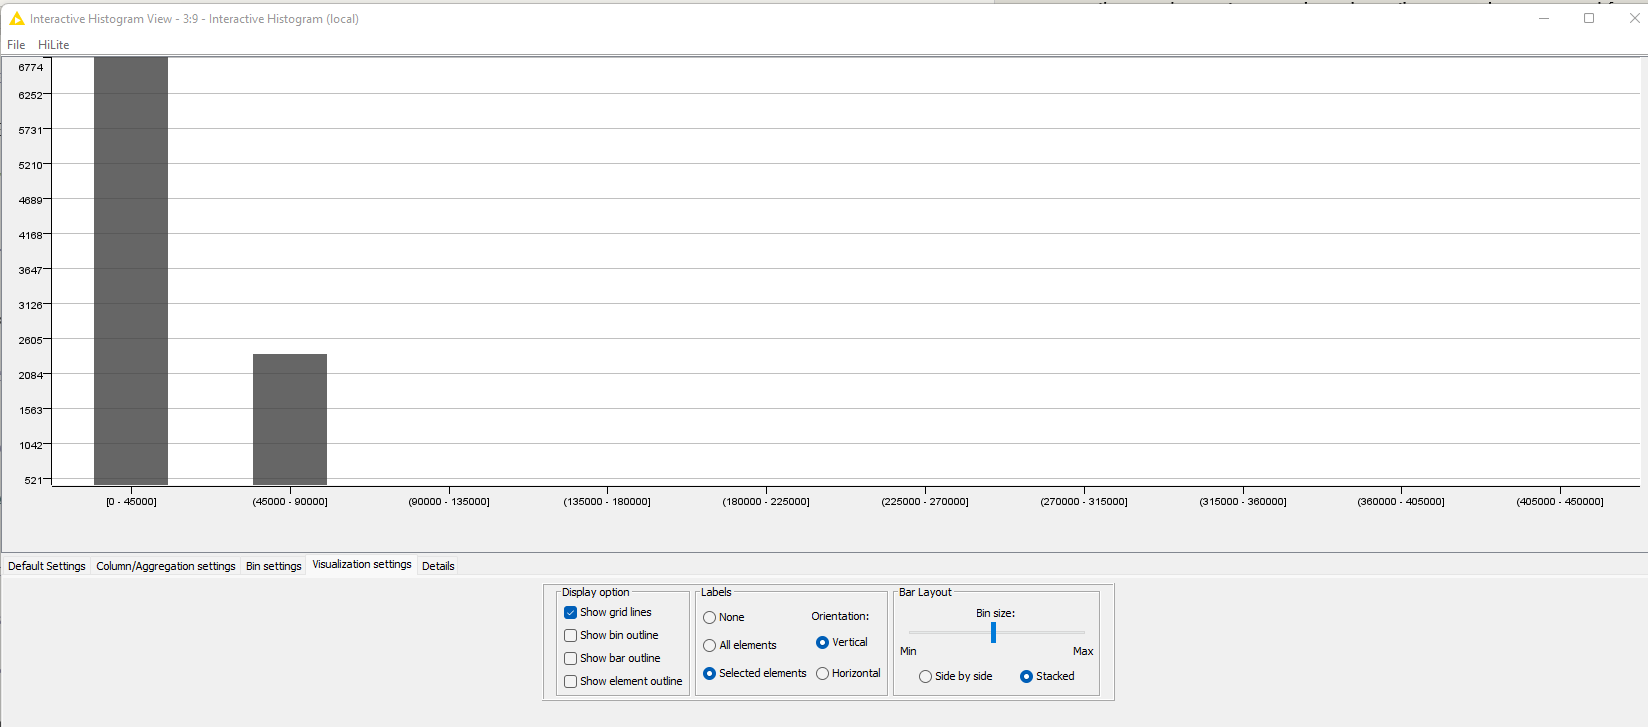
screen shot 2 shows the histogram after checking the “Show empty bins” box. Notice that the empty bins includes bins up to 450,000, even though values above 100,000 have been filtered out
-
screen shot 3 shows the results after writing out the filtered data to a .csv file and then reading that file and creating the histogram. It works fine. 10 bins ranging from 10,000 up to 100,400.
-
screen shot 4 confirms that the filtered data file has only 9,172 rows
So, for some reason, even though I filter out values above 100,000, the histogram node still thinks that there are values up to the original maximum of 449,996 such that when it creates 10 bins, it necessarily creates a lot of empty bins above 100,000.
thank you both for your help. if you have any insight into why the histogram node uses the maximum from the source data rather than the maximum from the filtered data to set its upper limit, I would appreciate that.
Sincerely, Buddy Jones

1 Like
This topic was automatically closed 90 days after the last reply. New replies are no longer allowed.