I am struggling with BIRT. I want to use it to prepare standardized ppt project reports. The resulting ppt file should contain one slide per project value in the dataset.
Creating a one-slider report works very well, where I struggle is to loop over the projects:
in the Advanced BIRT Example workflow, it is shown that this can be done by putting the data to report in a Table report item, and then using the Table > Groups > Expression + Page Break option to limit the content of the table to whatever matches the expression (here, the project), and move to a new slide
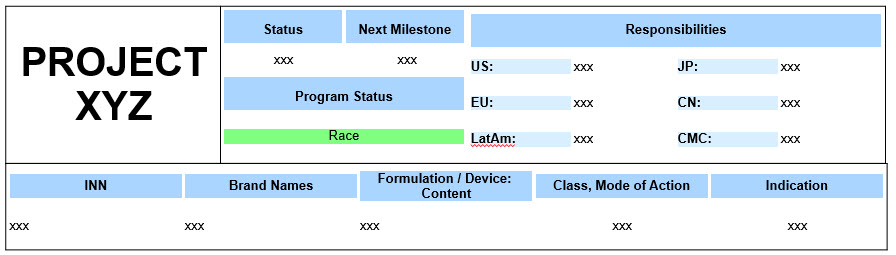
what I want to achieve is more complicated, in the sense that the report is built on nested Grids :
but the Grid Report item does not have a Groups tab that I could use to loop over the project values, just like with the Table item.
So to summarize, the Grid gives me the flexibility to customize the report as I want, Table is not flexible but allows for the creation of one slide per project …What could be the way to go forward?
I figured out, for those interested this is how I did it:
Create a 1*1 Grid
Drag the dataset from the Data Set View panel in the Grid. This creates a Table object
Select only the column containing the Identifier (one slide per value in that column)
Remove the Header and Footer rows, remove the data object from the cell, leaving an empty table
In the 11 Table contained in the 11 Grid, build up your report structure by adding one grid or more, configured as desired. You may need to nest Grids to obtain the desired outcome
Within that Grid’s cells, drag the dataset again and keep in each cell the property of interest and the Project; this will create a Table object
Remove the Header and Footer rows, delete the Project column, keep only the property of interest
Add Text objects when needed
In each of the “inner” tables, go to Filters and add a property: row[“Identifier”] equal to row._outer[“Identifier”]
In the outer 1*1 Table, go to Properties and add a Page Break after, Always