I am relatively new to Knime and am testing out its stat abilities.
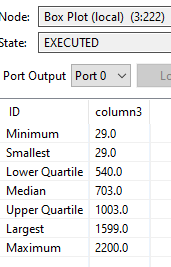
So I was playing with the box plot. Nice and simple to use. Here is data output. In the documentation it says the smallest and largest value (which I refer to as inner fences) are calculated as follows: Q1 - (1.5 * IQR) or Q3 + (1.5 * IQR). So far so good.
However, when I do my own calculations my values differ. The formula is the same, values are different.
Box plot node computes the largest (upper inner fence) as 1599.
-using its documented formula for the largest
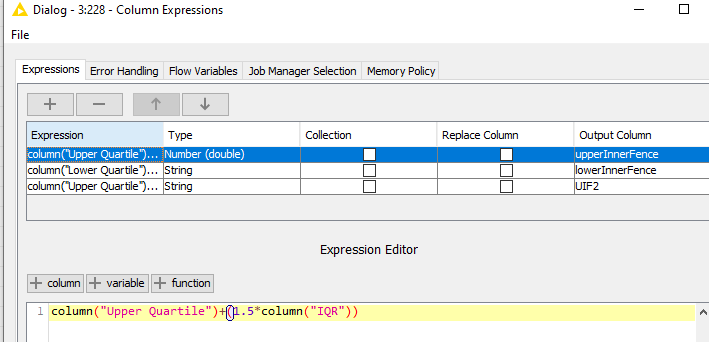
=1003 + (1.5 * (1003-540)) = 1697.5 NOT the reported 1599.
your calculation is correct.
What you’re interested in are the whisker boundaries and your formula shows the Inter-Quartil Range method. However, the whisker boundaries are actual points/observations, which should be the nearest to your calculated boundaries. That means between the Q3 and 1697,5 your point 1599 is the maximum.
For the lower whisker boundary, that’s even more obvious, as 540 - (1,5 * (1003-540)) = -154,5
and your overall minimum is 29 (=smallest/lower whisker boundary)
Here is a detailled definition of boxplot boundaries:
see the top of page 2.
You may also check your outliers using the node “numeric outliers” as it uses the 1.5 IQR method by default. Executing this, the 1599 should remain as the maximum.