May The Force be with you!
Is it possible to assign names to the outliers as in the attached figure?
The attached workflow contains the standard table and boxplot.
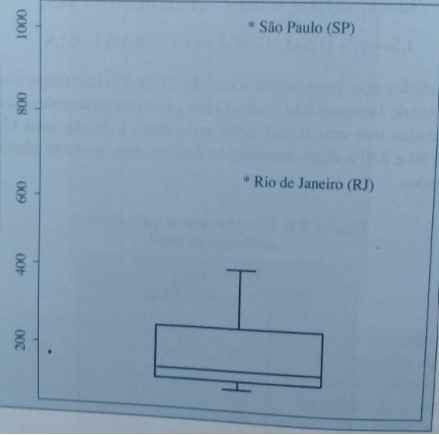

box_plot_names_forum.knwf (9.0 KB)
May The Force be with you!
Is it possible to assign names to the outliers as in the attached figure?
The attached workflow contains the standard table and boxplot.
Hi @darth_cruz -
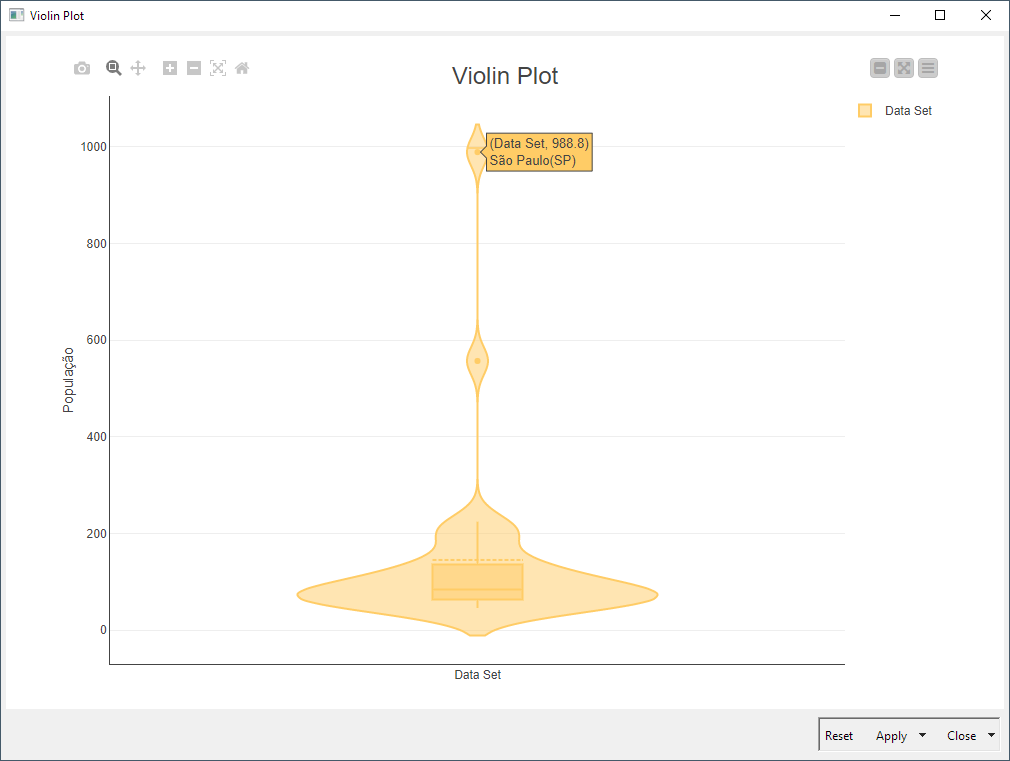
Unfortunately I don’t think there’s a great way to do this at the moment. The closest approximation I found was to use a RowID node to set the RowID equal to the Municipio column, and then you can see it, but only when you mouseover. Here I used the Violin Plot (Plotly) node since the tooltips are more prominent, but it works with the Box Plot too:
Ultimately, to get exactly what you want I think a bit of Python/R/Javascript scripting would be required.
Hi @ScottF !
I won’t use scripts in R or Python cause I’m looking for a “no code solution”.
Can you attach your workflow please?
Tks a lot!
Hello @darth_cruz ,
I believe the workflow with the Violin Plot should be something similar.
Hope it helps!
box_plot_names_forum_vs2.knwf (13.3 KB)
This topic was automatically closed 90 days after the last reply. New replies are no longer allowed.