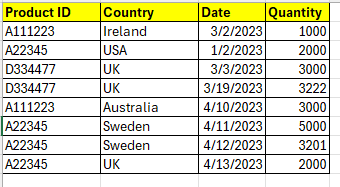
I have a set of data showing the daily production quantity of the product and the factory location. Like the image below
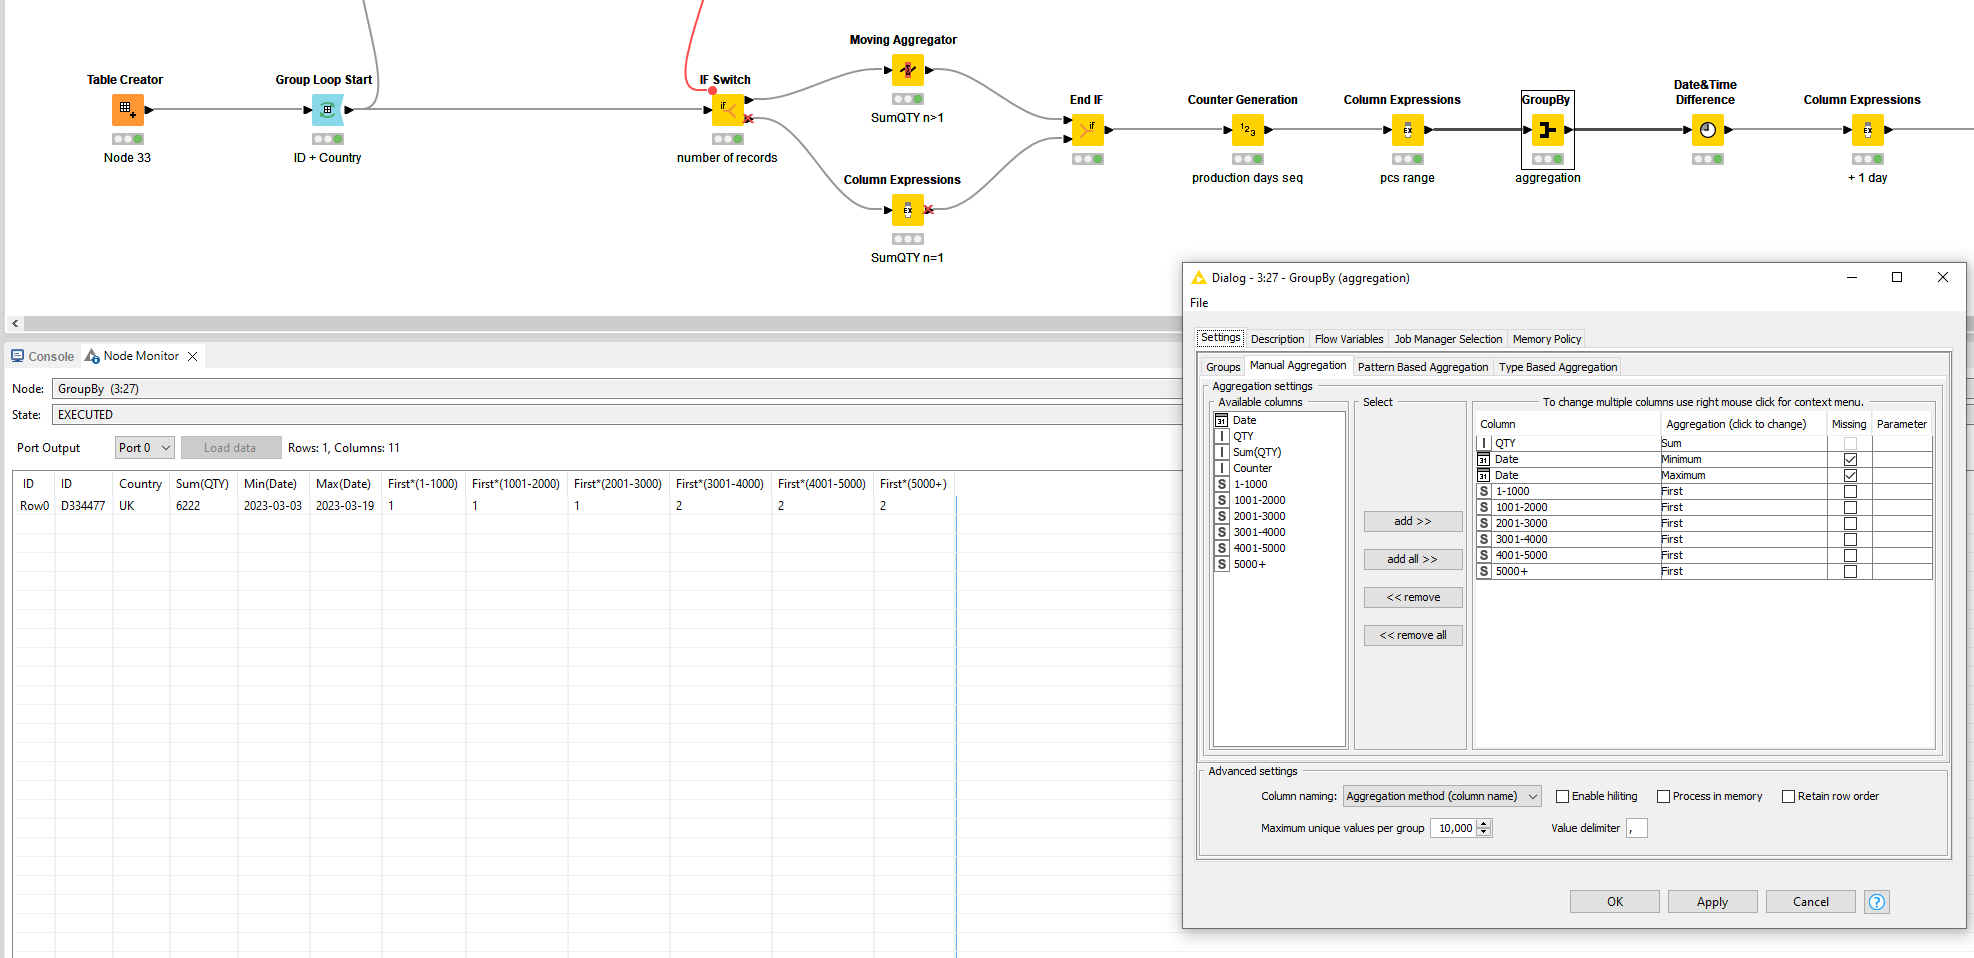
I need to build a dataset to show for each product by country level,
the first day and the last day for the production, and how long is the production period.
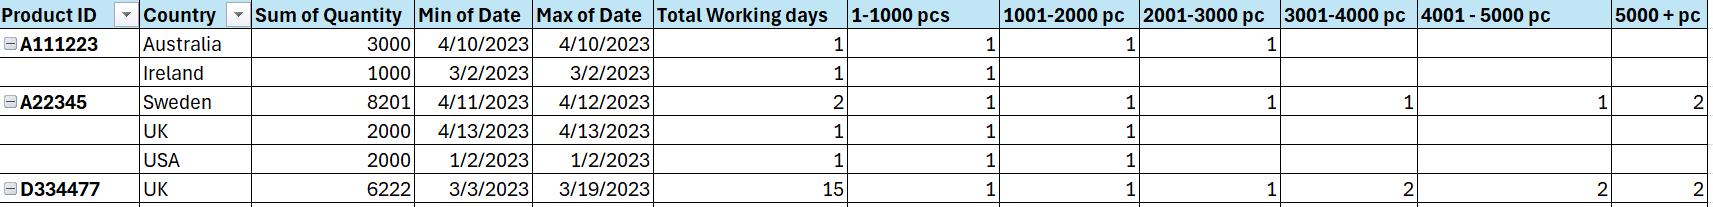
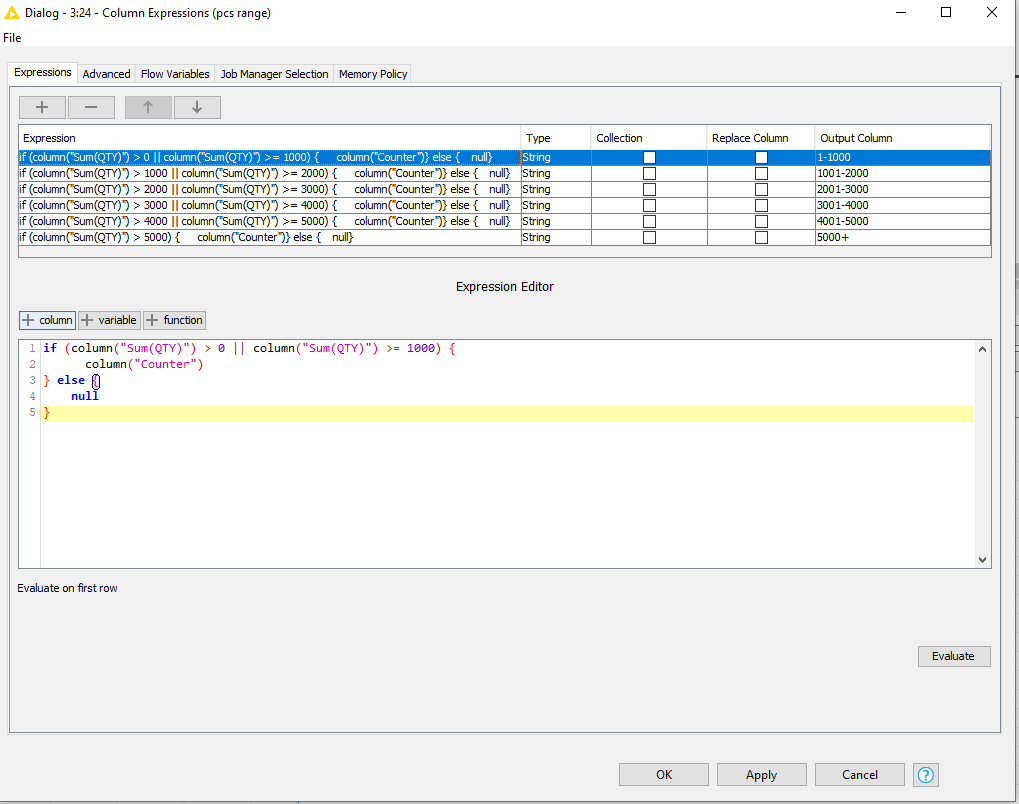
Also, I need to show production time by range.
1-1000 pc, how long does it take, then 1001 -2000,2001-3000…
Just like the chart below
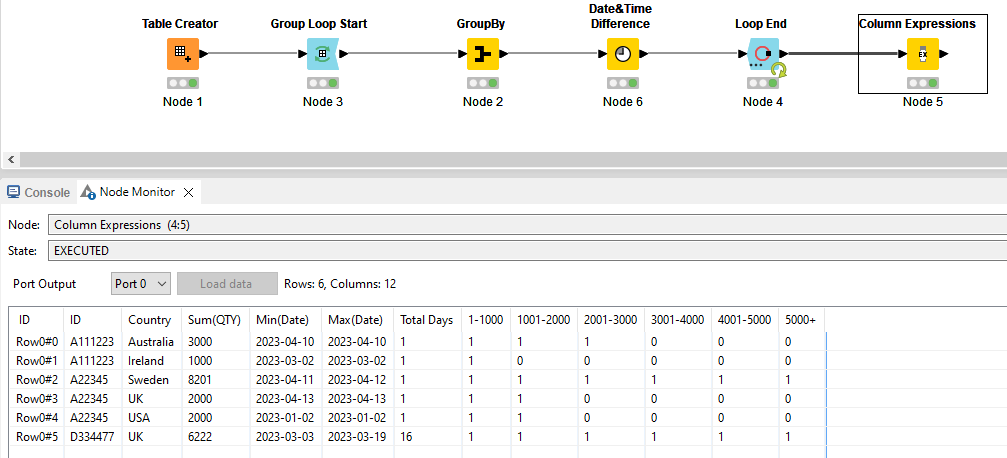
I want to use Group By but then I cannot keep the date column.
Or should I do it like the image shows. find the first day and the last day, and then minus them?
And also how do I build the range (1-1000,1001-2000…)
But I must say that your desired output is difficult to understand for the pcs columns. It seems that you want to have the sum of the flags for each individual value but currently it looks inconsistent.
For example, the QTY of 8201 for Sweden is flagged twice under the 5000+ category but the value is made up out of 5000 and 3201 so I would expect a value of 1. Then for 1-1000, 1001-2000 and 2001-3000 I would expect a value of 2. Same goes for D334477 that only has values of 3000 and 3222 so that never surpasses 5000 but is still flagged twice as well.
Even if the pcs columns are to be derived from the QTY, the current pcs values also do not align.
Can you have another look and more precisely clarify what the logic should be for those columns?
Raw data.xlsx (9.6 KB)
I put the file to here now.
First at all, thank you so much for you tip and you even made your own version. I cannot thank you enough.
For those 1 - 1000 pc, 1001 - 2000 pc…
Let’s use the Sweden one as an example:
The total Quantity is 5000 + 3201. Which is 8201 in total.
I am counting how many days can the factory produce within those range.
It takes two days to finish 8201 pcs.
And the first day 4/11/2023, they made 5000 pc
So that means it needs 1 day to finish 1-1000 pc…up till 40001 - 5000.
All of them will be 1.
And then the second day they start making from 5001 pc…
So 5000 + pcs will be 2.
Please let me know if I did not explain clearly.
Thank you so much once again.
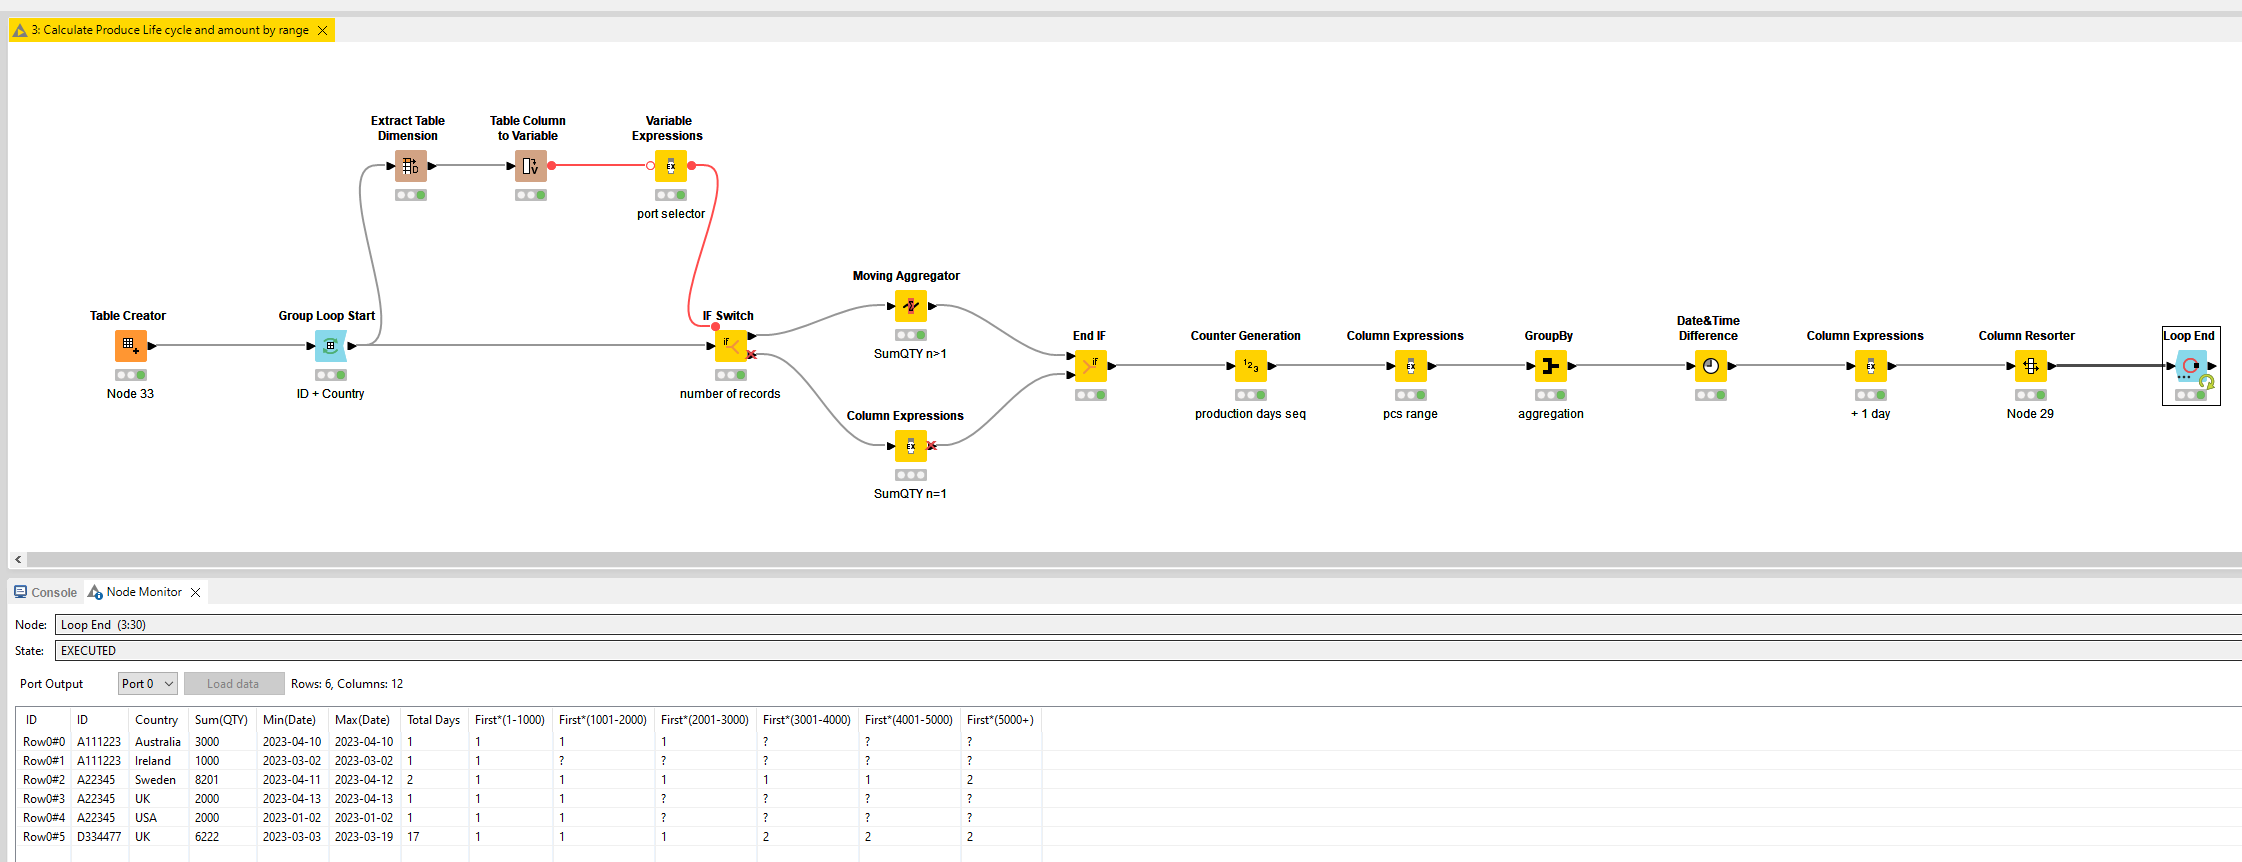
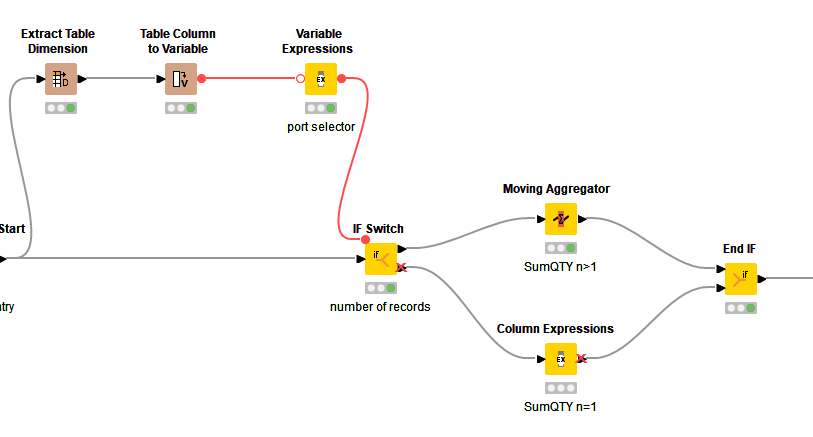
Main steps are determining the moving sum of the QTY and then set the ranges accordingly. Since there are some groups with just one row, there is an IF-Switch that picks the right method since a windowsize of 1 is not possible for the Moving Aggregator node.
The Counter Generation node is used to create a sequence number for each production day. The Column Expression assigns the production day sequence to the corresponding columns for the pcs range.
The rest is cleanup work and not very exciting. I tested this with additional scenario’s that your current file does not cover, like 3 production days and that seems to hold up fine but please test it with your actual dataset. I did not bother renaming all the columns but that can be added off course