Every row corresponds to a patient. Different parameters from voice patients have been measured. The first fifteen columns from the data set indicate the fundamental frequency of different vowels. The fundamental frequency is characteristic in each person, so its value varies among different people but it should be the same in different vowels of the same person.
In every row of the dataset, I would like to calculate the variance among the first fifteen columns and eliminate values which are outliers. I would like to replace these values for missing values in these cases.
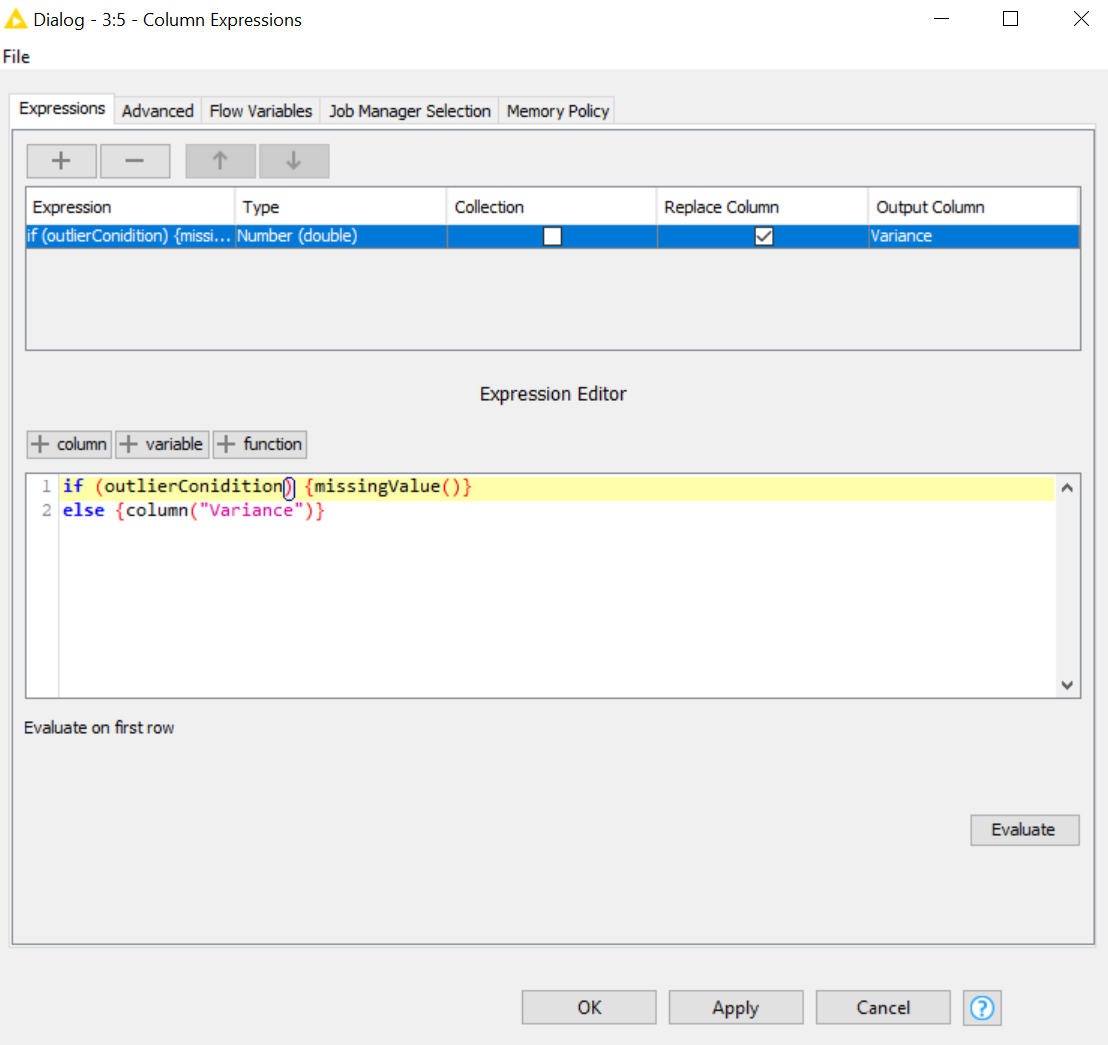
You can calculate the variance across the columns using the Column Aggregator node. You can then use the Column Expressions node to replace outlier values with null values. For your reference, the screenshot below illustrates how this might be accomplished - “outlierCondition” will need to be replaced with an expression that returns true if the value is an outlier.
Hi @helfortuny. How are you going to define your outliers?. Interquartile range or a certain proportion of the standard deviation k*standard deviation? have you checked the numeric outliers node? @sforesti solution is the most general one