Hi!
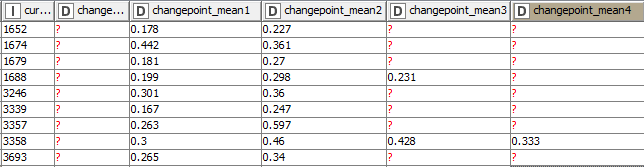
I’m working with the R Snippet and the “changepoint” package to loop over stores and find change points in demand. Some stores have 1 change point, others have 2, some have a high amount like 7 changes in demand. The output looks like the following:
(The first column is a unique key/id number)
I’m wondering what the best way to calculate the difference in means for the row’s most recent change point (changepoint_meanN) from its first change point (changepoint_mean1). Given that each row has a different most recent change point is where my challenge lies.
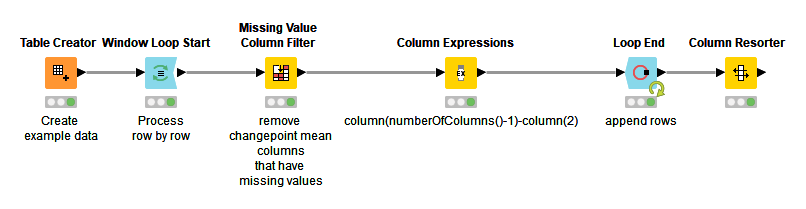
I’ve though of using a loop approach where I take each row separately, filter out missing columns (therefore I’m only left with the key/id and its changepoints), then do a calculation… But I haven’t been able to find something like using the max column index and using that in a formula.
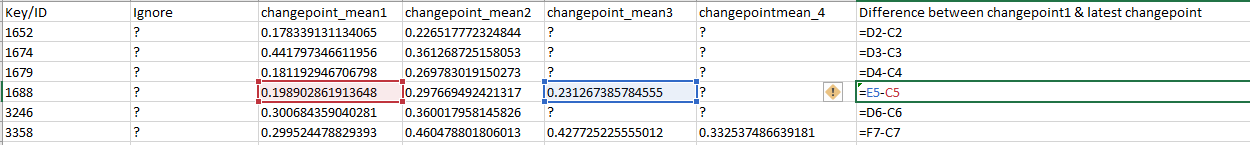
I played around with this a little and came up with something simple. It’s not that elegant, and it might break with a larger dataset, but it might get you started:
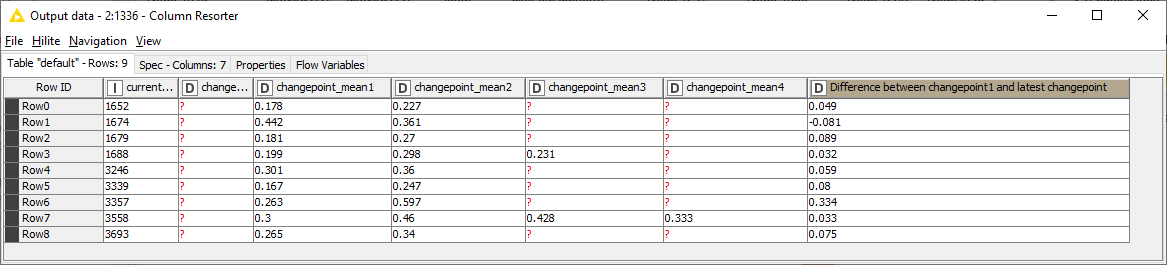
Nice one @elsamuel! Like the use case for Column Expressions node
Alternatively one can use Column Aggregator with method Last on all changepoint columns with missing option not checked and then use new column in calculation.
Thanks to you both @ipazin and @elsamuel ! Both solutions work nicely, but I have incorporated ipazin’s solution into my workflow since it avoids a loop. I always forget how handy the Column Aggregator node is.