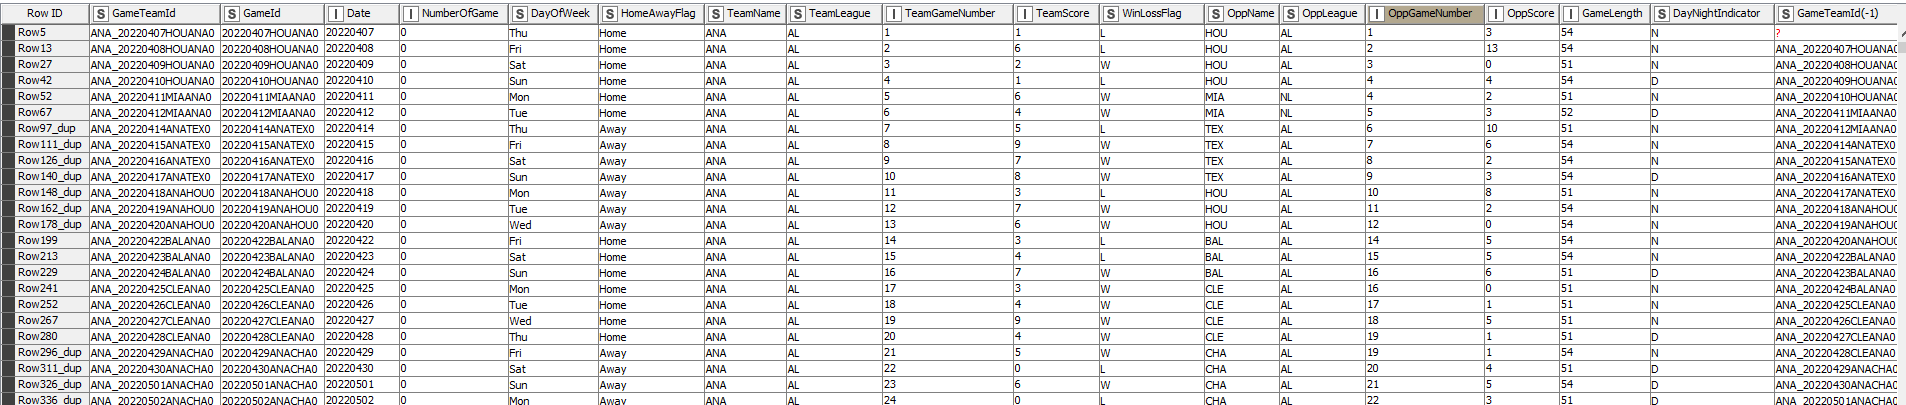
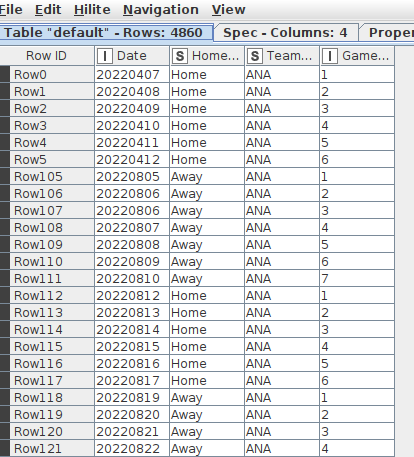
I have a dataset on baseball games, and I’d like to derive a few values which I could best describe as running totals that would reset. One is “GamesSinceLastHomeGame”, which would be reset to 1 on the first away game, and would climb by 1 every game until they play at home again.
I know I can use the Column Lag to access the last row, and I could use two of them to get the last 2 rows, but has to be a more elegant way to achieve what I am after?
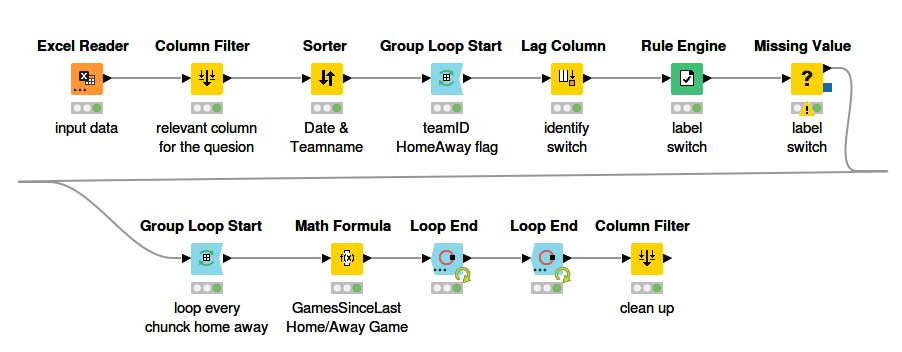
Why you just try to add a column to add 1 if the game gone and after that, make a group by to sum this information as a resume? You can select columns at the group by to show the resume information and make a calculation like SUM of this field.
If you can bring here an example of data, we can help you more!
I made a mount point from the excel path, if need, just adjust this information from the excel reader node at your local computer.
I made a sum of the all rows that have numbers and change the date column from string to date type to help me after to extract information to year, month, quarter dates as you can see after.
Hi Hans, but, correct me if i made any mistake, but the number don’t need to be filtered from another way? example: today is 2023-03-01 and the home game happen at 2023-02-28, so it takes just 1 day. the order that you set is inverted right? the first date need calculate with the hightest value to lowest value.
I believe that just reorder the date from newer to older resolved this question without any other changes of your flow, correct?
Hans, sorry for my delayed response, it took me some time to to be able to dive into this, but I have it working! I was able to copy that to get the Number of Games since last Win/Loss too. Thank you so much!