I am trying to plot the interactive scatter plot with two series of data with KNIME. It is better to have a vertical line connecting two Ys for each X or Row ID.
Here is the link of how to do that via Python Matplotlib. But Python plot is not interactive in KNIME.
I wonder if there is any way of creating the same plot (but interactive with Table of Data, i.e. by selecting one connection in the plot, the row will be selected as well) in KNIME
Hi @chf42
A couple of clarifications about the previous post:
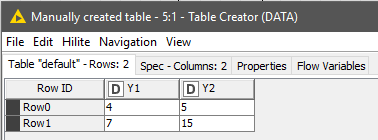
Once released the post, I realised that there were 2 misplaced numbers in the input DF; an i didn’t want to edit the whole post by then. The result is just aesthetic as retyping the numbers in the right order within the ‘Table Creator’ node, it will fit the proposed matrix.
[…]
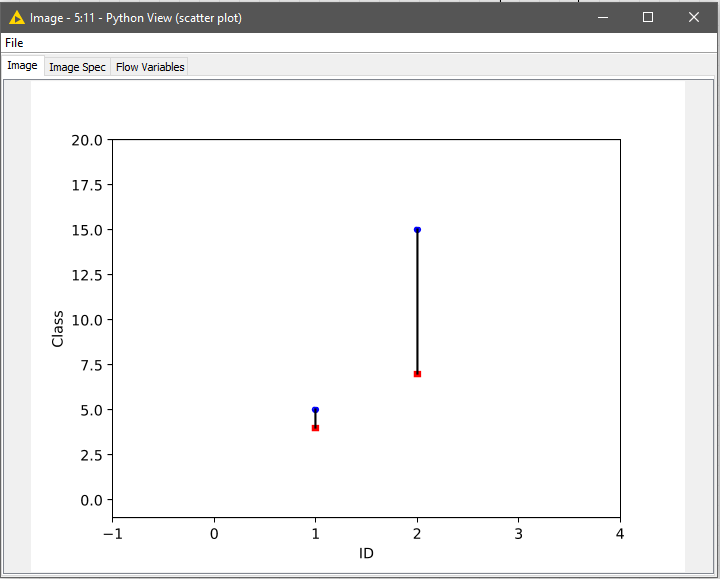
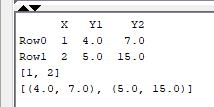
As you can see the RowID starts the counting number from zero, but in your example starts in X =1. The chart is plotting at abscissa values 1 and 2, as in the request. This is adjusted in the ‘Python Script’ transformation node. This difference can be easily adjusted in the code at row 10
df["X"] = df["X"] + 1
resulting in the feeding data for the scatter chart at ‘Python View’ node.
Thank you so much for your prompt response! Yes, the Python View can create the plot, but the plot is not interactive, e.g. not interactive with TableView for the same data.
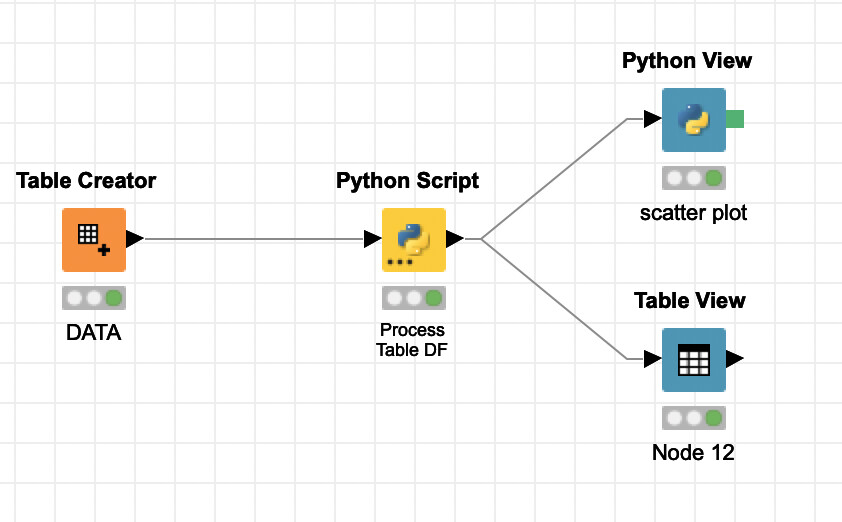
Please see the workflow below. I would like to create a plot that could talk with the table view. Is there any way to do that? We probably need something like PythonView JavaScript version (I guess)
Hi @chf42 ,
I wasn’t fully aware about the type of interactivity. I won’t be very helpful on functionalities for visualisations nodes in KNIME
However, depending on the degree of interactivity requested… I mean, if integrating the table and the chart in a single interacting multi-plot is an option; you can give a it a try by customising the chart and the table with Plotly library
Thanks for the suggestions of using Plotly library. I did check that but I could not find the functionality of sketching multiple Ys with one X in one plot
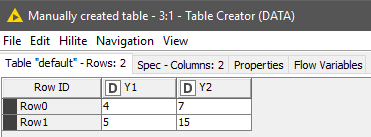
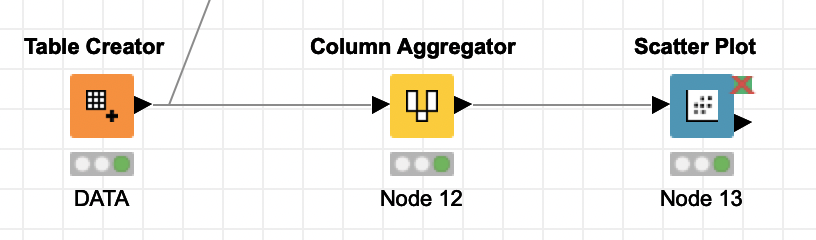
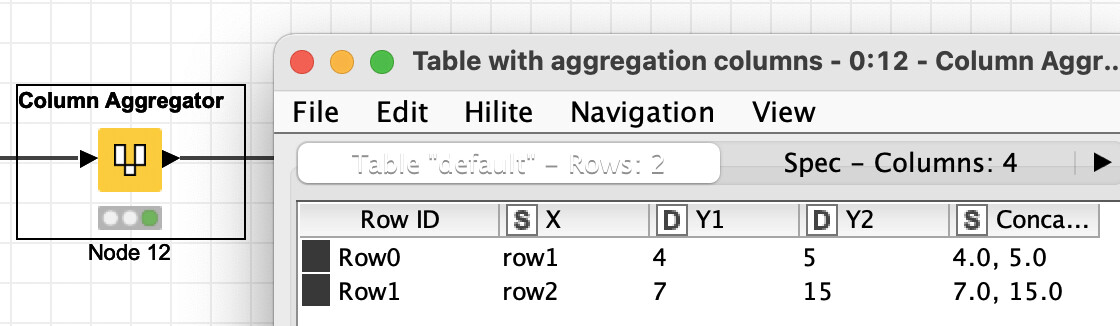
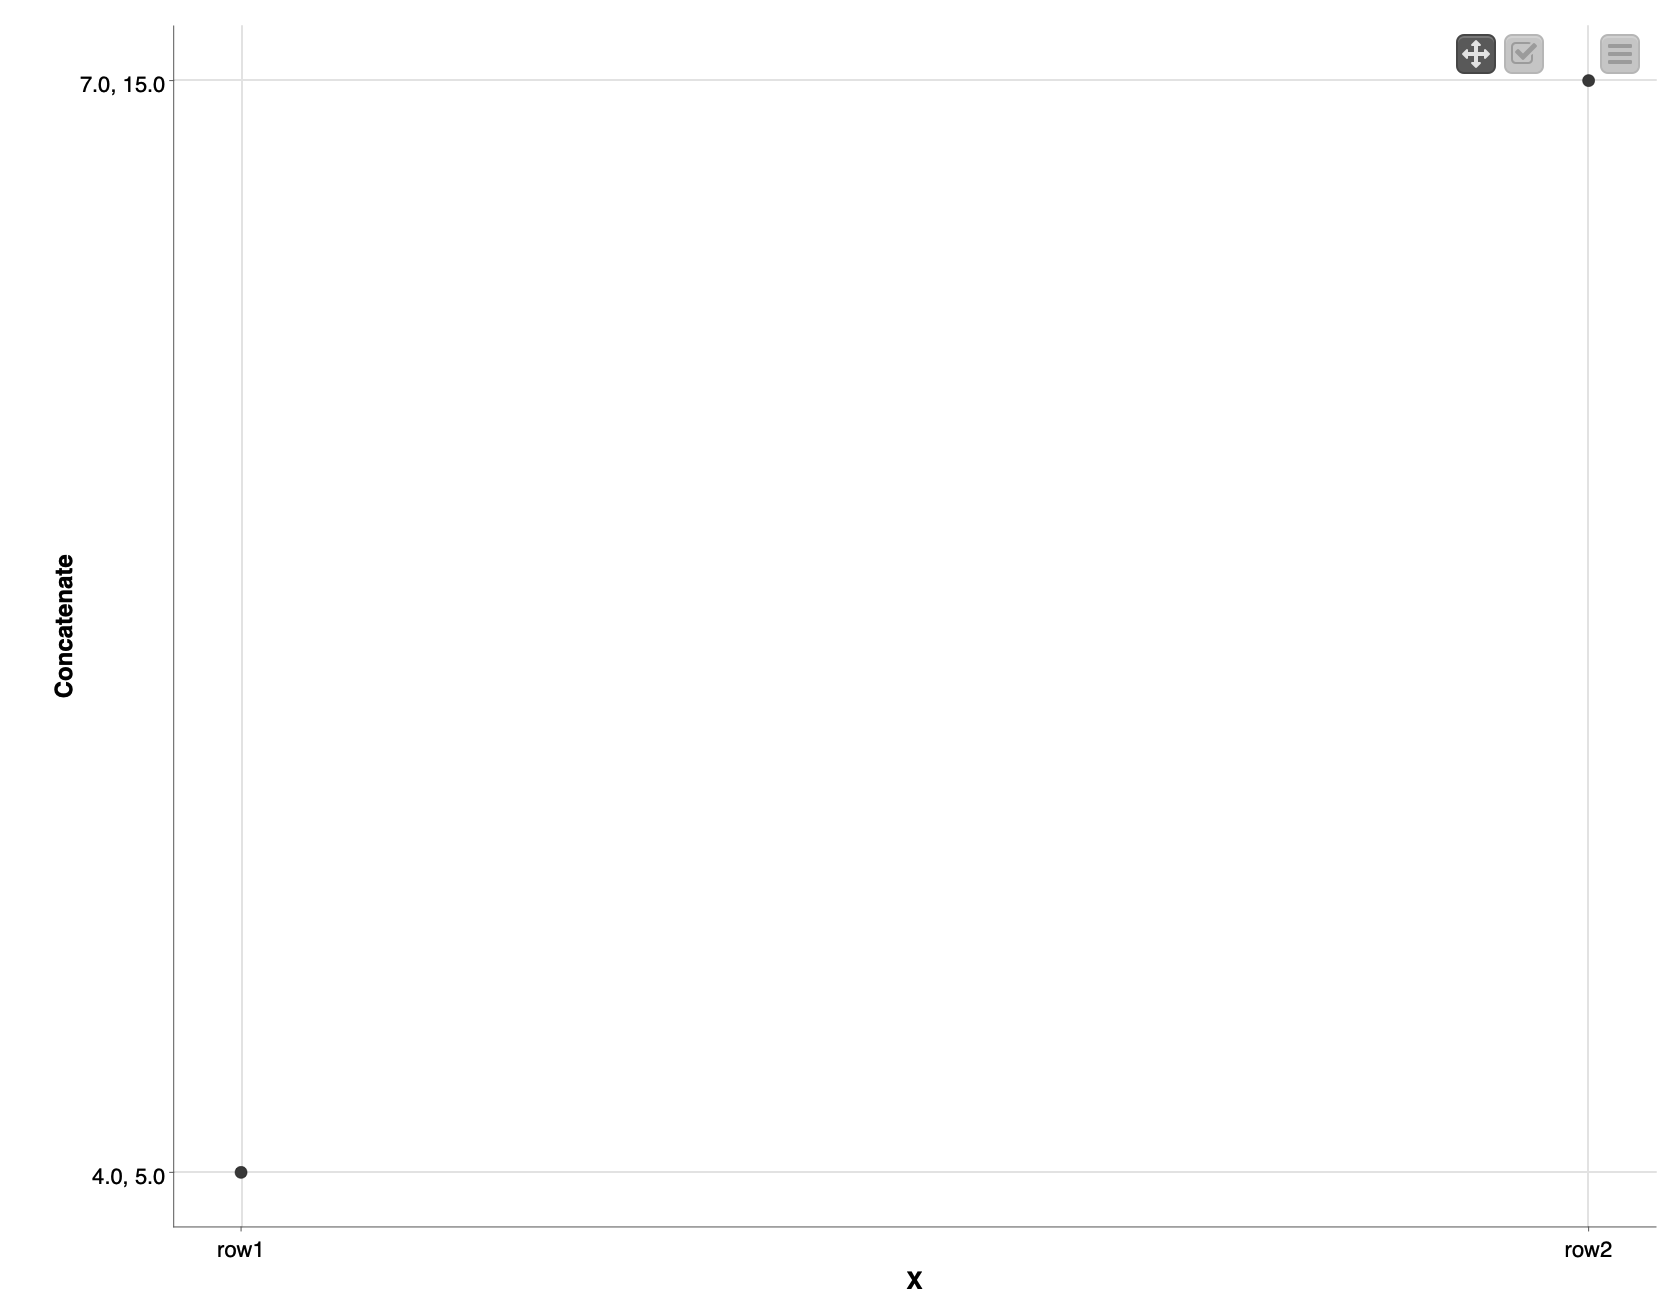
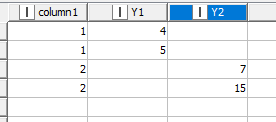
you can leave each Y in their own column and use Line Plot to get what you want. Only you need a bit different (modified) table structure like this:
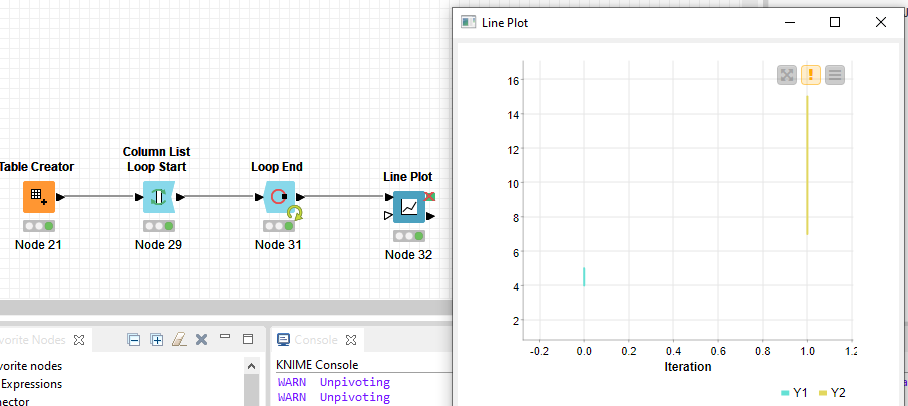
To get there you can use “dummy” Column List Loop with Loop End at the end where you should allow changing table specification and add iteration column which you will use as x-axis column.
Regarding Line Plots there are two you can use - Line Plot (JavaScript) and Line Plot (Plotly) but not sure will their’s interaction level suit you so might wanna check Refresh Button Widget node. For inspiration check out this blog post: