Hello,
I have this table:
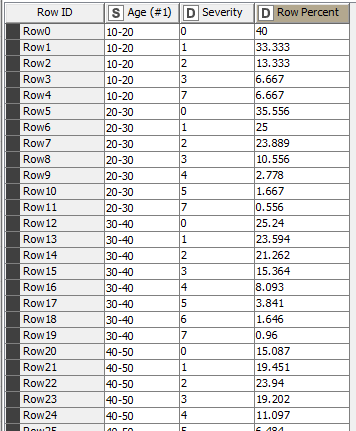
I want to display these values in a heatmap. For this I need them differently arranged.
I need the ages as RowIDs, the severities from 0-11 as columns and Row Percent as values. Like this:
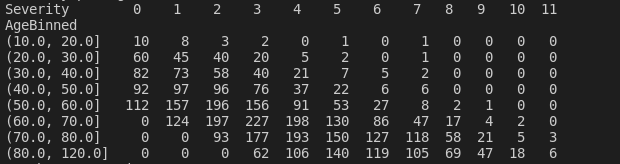
But I can’t find a node that can do that.
Thanks
Eric
Hello @RapidDuck and welcome to the KNIME community
Your node is ‘Pivoting’
BR
5 Likes
Welcome to the forum @RapidDuck
The node you’re looking for is the Pivoting node. You’d group by Age, Pivot on Severity, and Aggregate by Row Percent using First.
5 Likes
Hi @elsamuel
Without knowing the data in advance. I would suggest an aggregation by Mean.
@RapidDuck, explore your Output for the desired results.
BR
2 Likes
Thanks to you both. Worked perfectly!
2 Likes
system
Closed
6
This topic was automatically closed 7 days after the last reply. New replies are no longer allowed.