Hi @SilAlpizar , I thought I’d give this a go anyway, and see what happens!
This was much more involved than I would have hoped, but matching data to tables across multiple columns and determining how they match (whilst trying to produce a generic solution, that makes no assumptions about the actual number of columns) was more problematic than I had originally thought.
I suspect that some form of loop could be employed to make this more succinct, but I tried to tackle it without using any iteration.
My thoughts were that we needed to produce some kind of “fingerprint” or “key” for each scenario, and then attempt to turn our (Report1 vs Report 2) matching data into the same form of key.
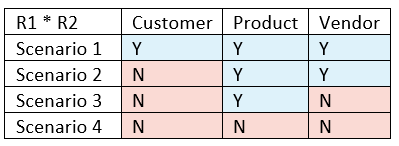
Taking the scenarios data first:
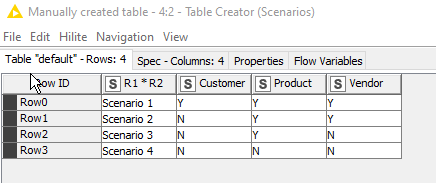
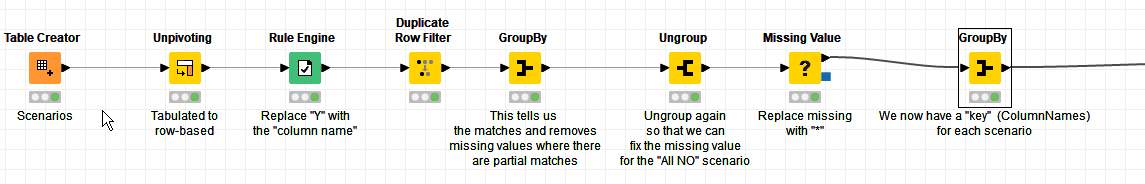
I unpivoted this so that it became row-based
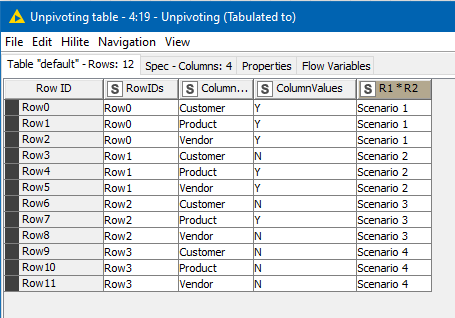
This is because rows are generally much easier to work on generically than columns of tabulated data.
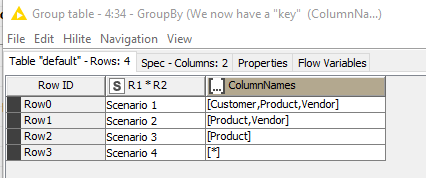
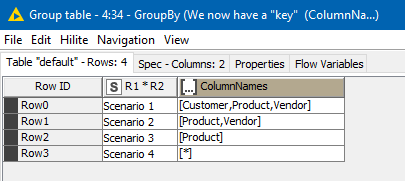
After a variety of GroupBy Ungroup and rule engine, I turned this into a “key” column called “ColumnNames” for each scenario:
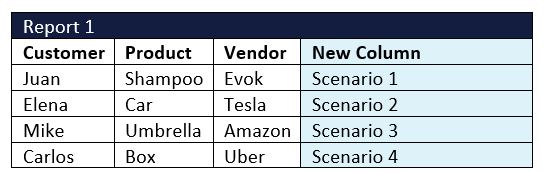
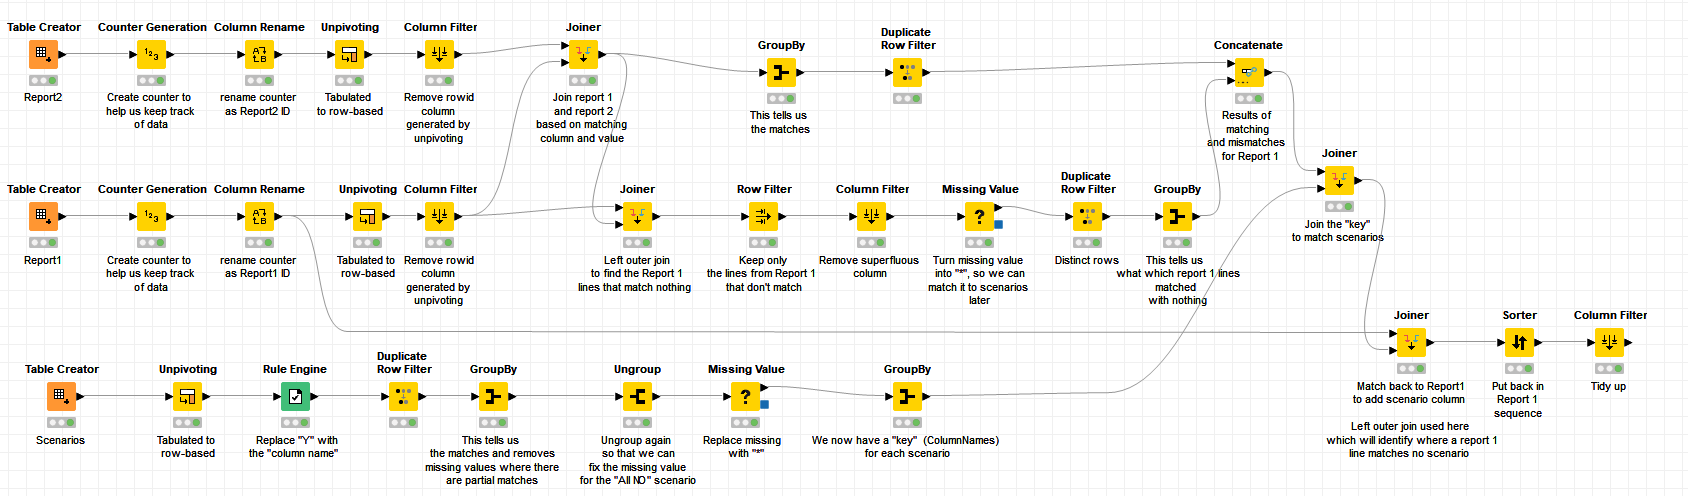
The next piece was trying to match Report 1 with Report 2 generically, and turning the result into the same form of “Key” that you see above.
The first step in transforming Report 1 and Report 2 for easy matching was once again an Unpivot which made the tabulated data into rows of data
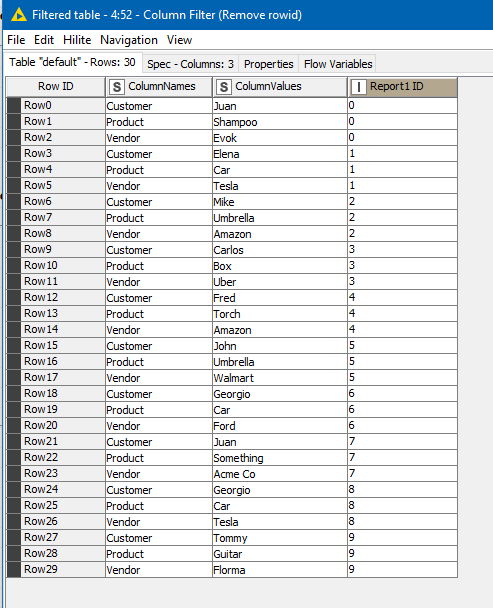
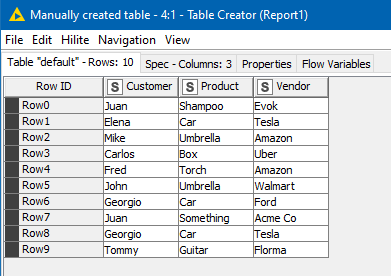
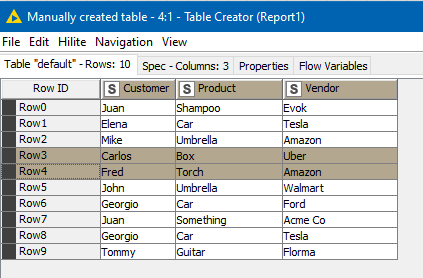
I added a few extra rows to Report 1 for testing purposes, and so we have this:
unpivoted (with a few other transformations) into this:
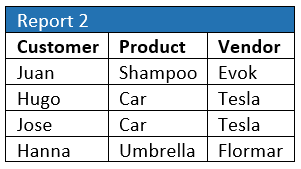
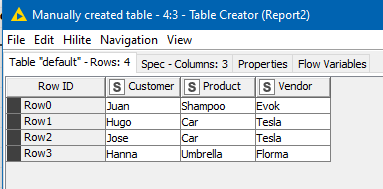
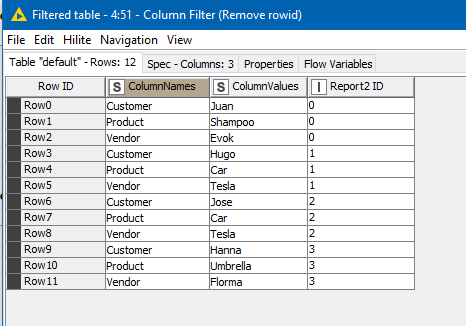
Report 2 likewise was unpivoted from this:
into this:
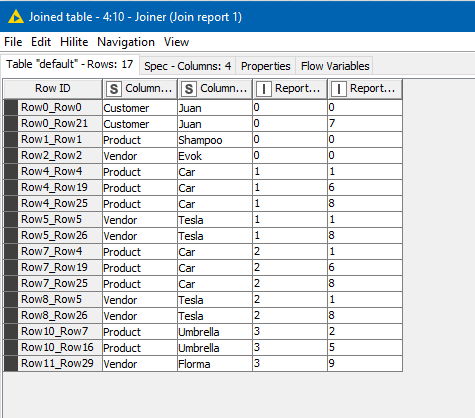
An inner join on the transformed report 1 and report 2, joining on “ColumnNames” and “ColumnValues” columns, tells us which lines of each report match.
and then a GroupBy and a Duplicate Row Filter tell us, for those rows that matched, which lines on Report 1 matched to which lines on Report 2, and “how”
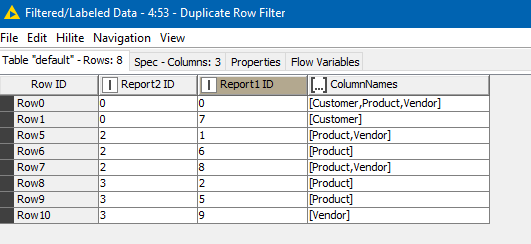
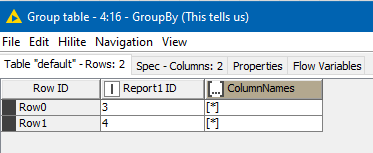
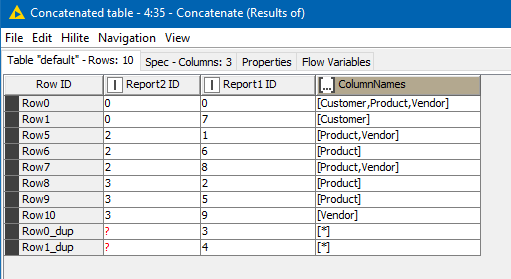
In my test data, there were some Report 1 lines (number 3 and 4) for which there is no match to Report 2
These will have “dropped out” of the data from the Joiner nodes as I was doing only inner joins, so a split in the processing is used to form them into their own table, and using a “*” to indicate that they are all missing.
This is then concatenated with the “matched” set to form the complete table
and then this can be joined to the original “scenarios” data that we created at the beginning
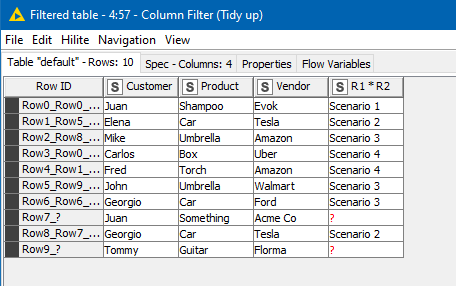
After re-sorting back in Report 1 order, and tidying up, we get the result, which also shows where data didn’t match any scenario
The workflow is attached, at least as a place to start. Perhaps somebody might have an alternative solution (I suspect that a solution using a loop might result in fewer nodes), or perhaps somebody can spot some shortcuts to what I’ve produced here, as there is so often “another node” that can be used as an alternative. I often use the Joiner (Labs) nodes where I am dealing with “non-matching data” too, and possibly this would be simplified a little if they were used in place of one or more of the Joiner nodes. Anyway, here it is, “warts and all” ! You might have your own ideas on how it can be simplified.
Match two tables and scenarios data.knwf (66.6 KB)