Hi, I am trying to change the Minimum and Maximum Values for the graph, so the X axis dan Y axis will have the same scale range. (Just like set the min max axis options in spreadsheet).
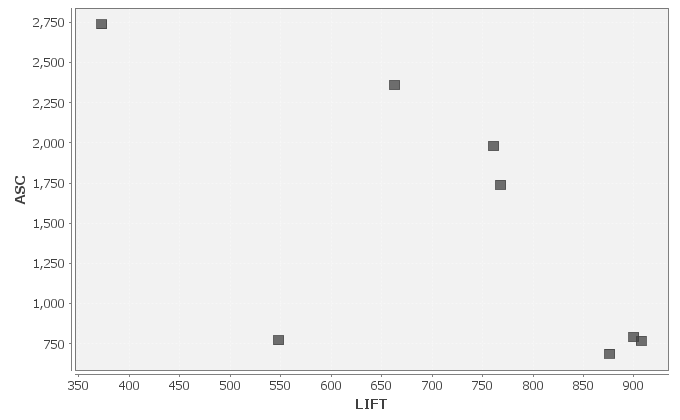
Do you guys have any solution?
Thank you
Hi, I am trying to change the Minimum and Maximum Values for the graph, so the X axis dan Y axis will have the same scale range. (Just like set the min max axis options in spreadsheet).
Do you guys have any solution?
Thank you
Welcome to the forum @rizky_kahfie.
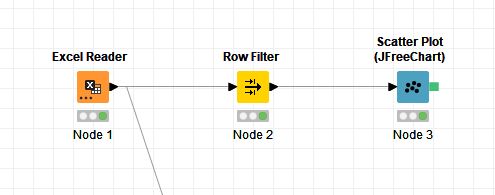
If you want to specify the axis limits I’d use the Scatter Plot node. This node will allow you to apply variables that will define xAxisMin, xAxisMax, yAxisMin, and yAxisMax. You’d need to create these variables, make them available to the Scatter Plot node, then apply them in the Flow Variables tab.
thank you, I made it…
This topic was automatically closed 7 days after the last reply. New replies are no longer allowed.