Changing the color of the histogram node

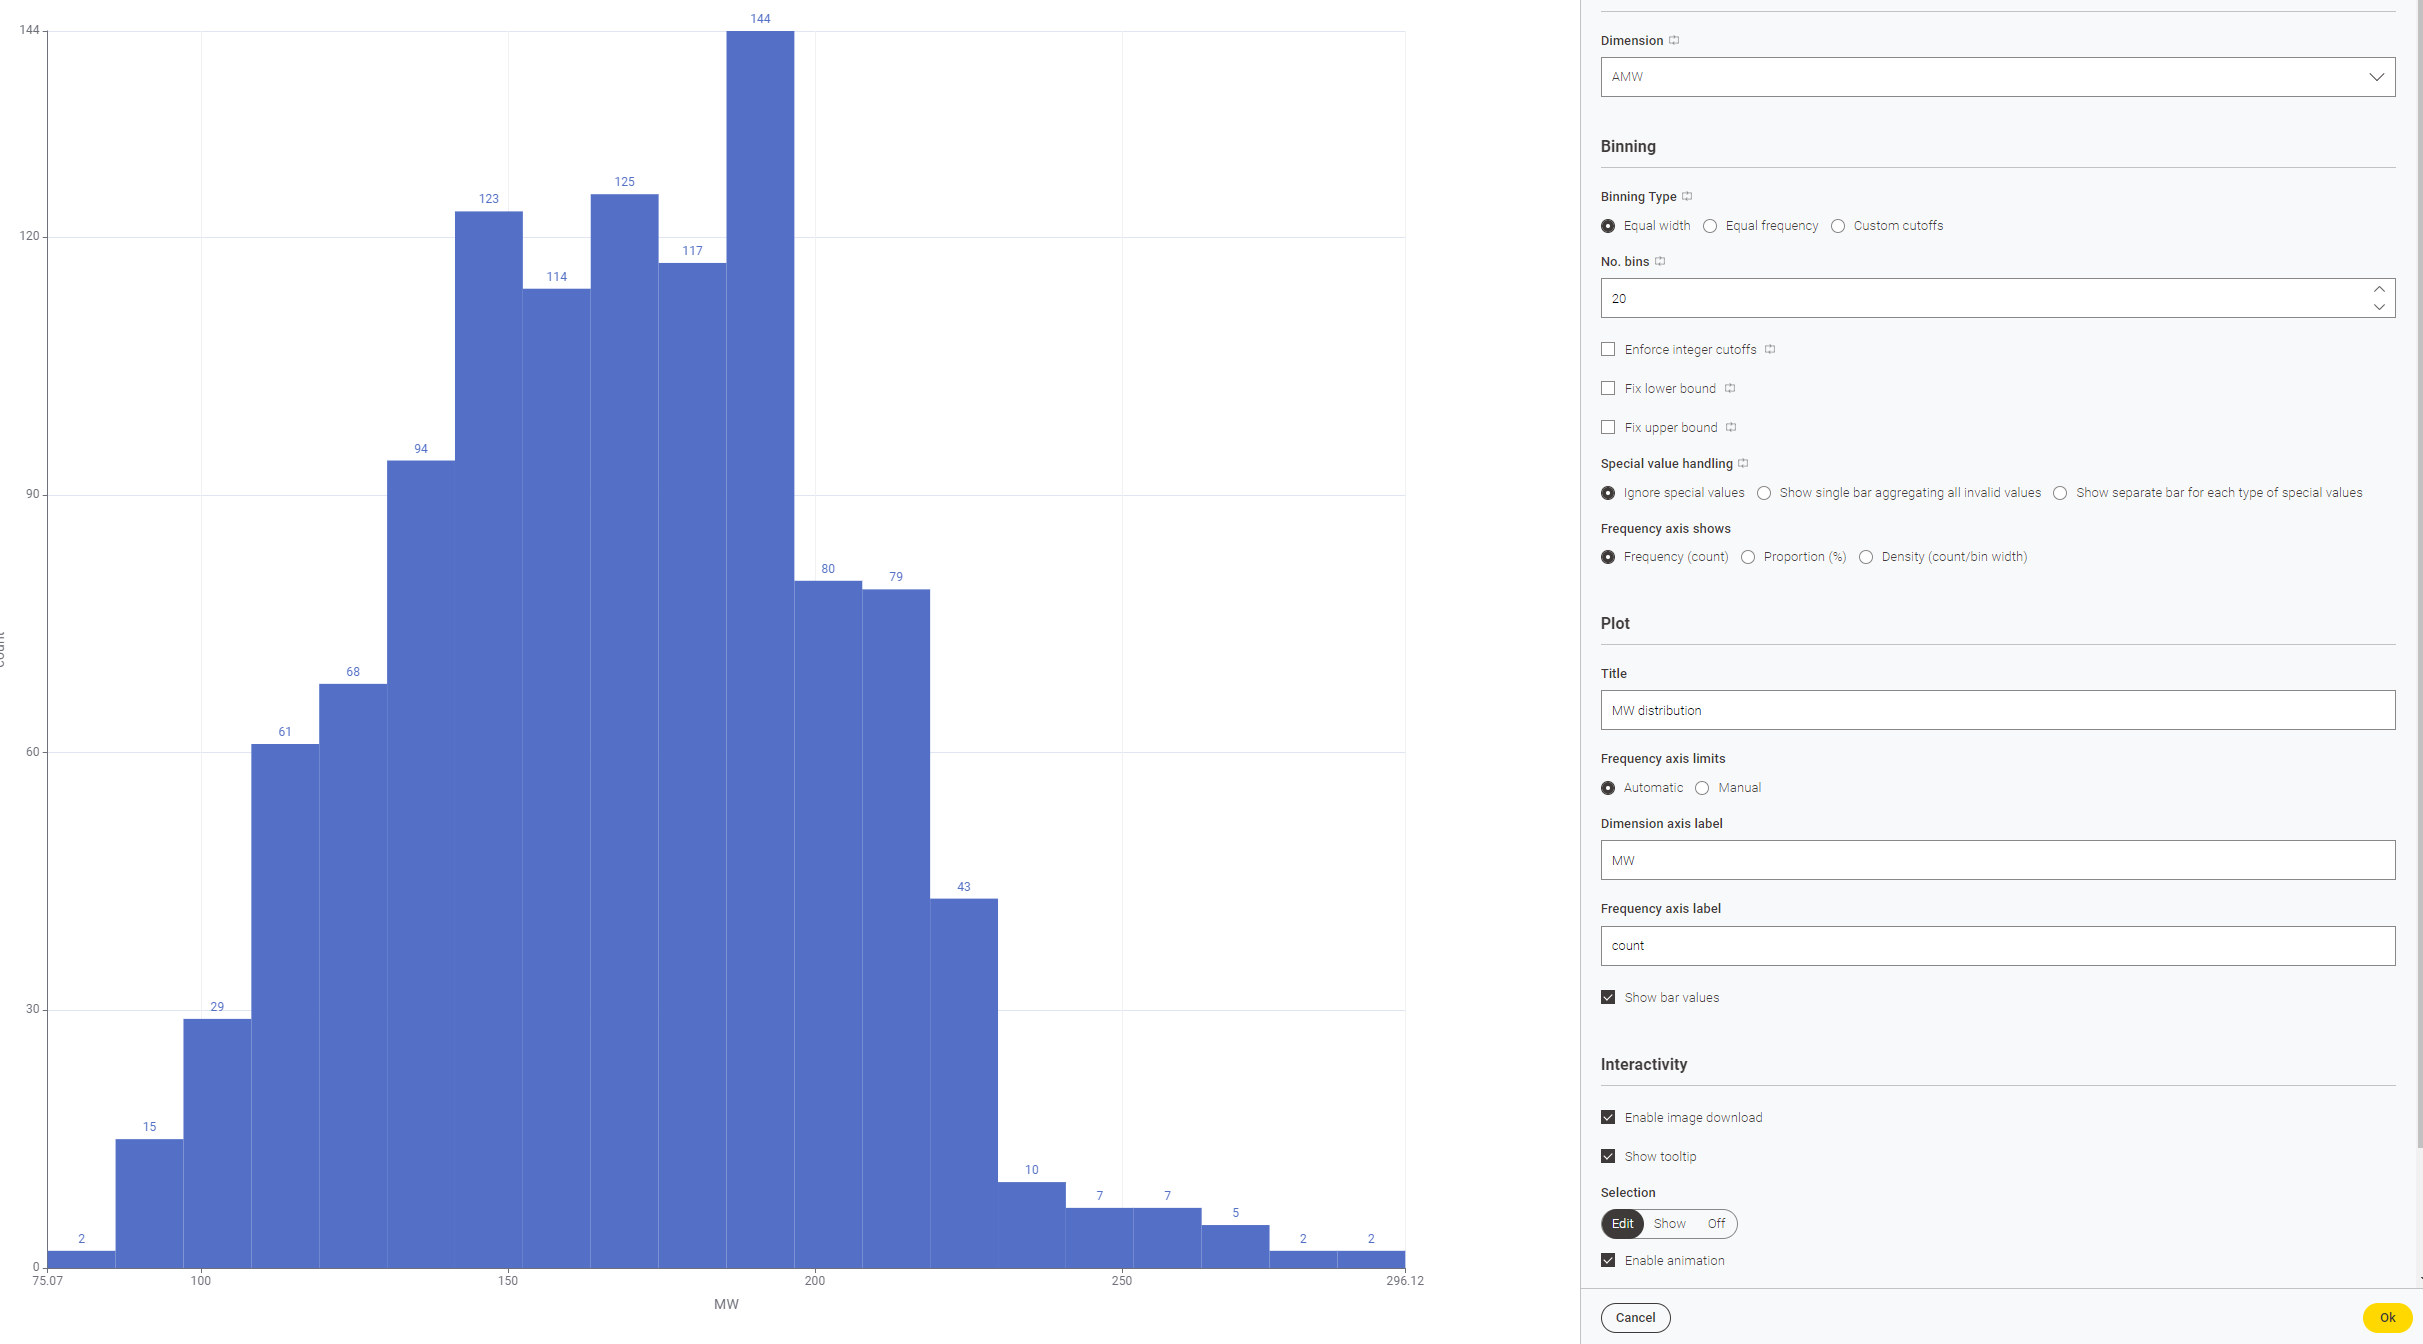
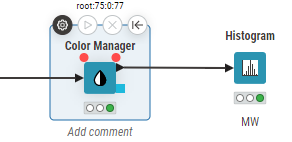
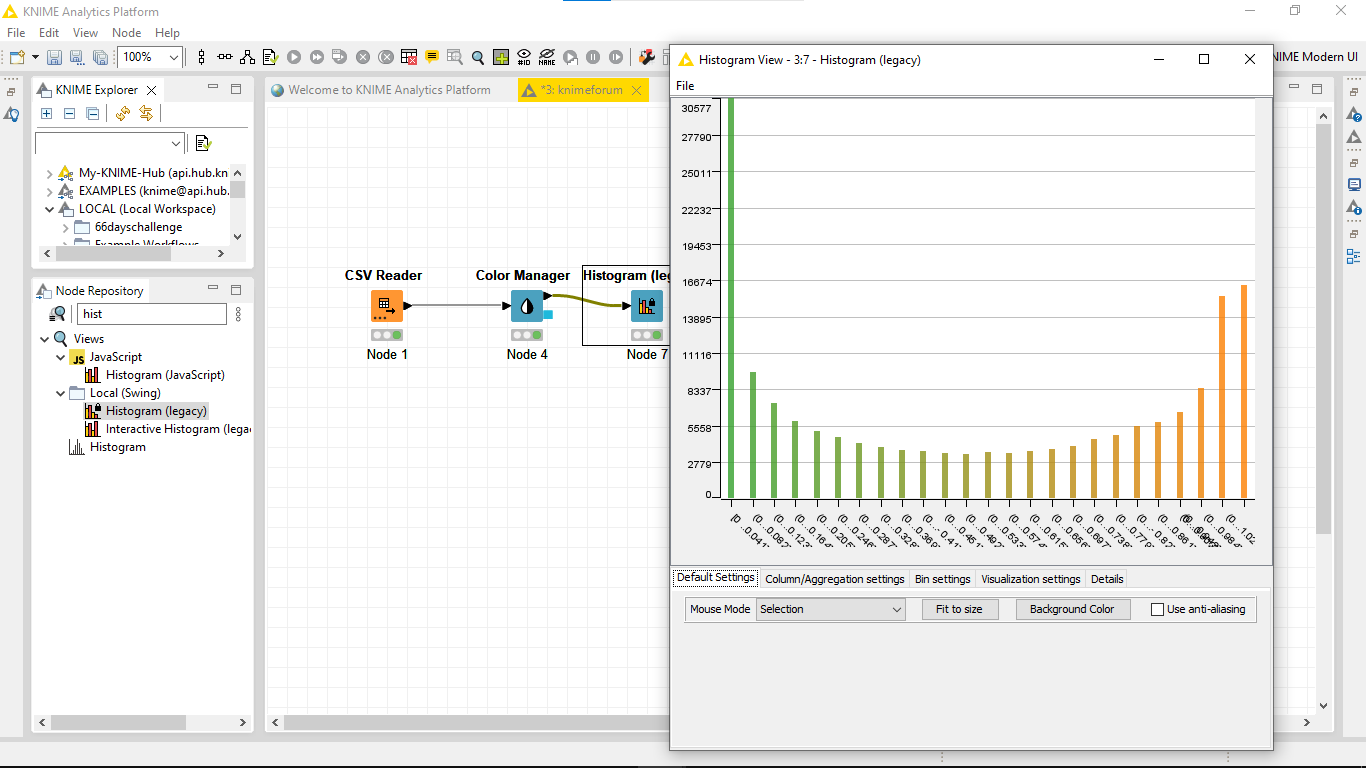
I tried to generate a histogram of my data using both the histogram and histogram(javascript) node and I wanted them to have a custom color but I don’t know how to change it from the standard blue color.

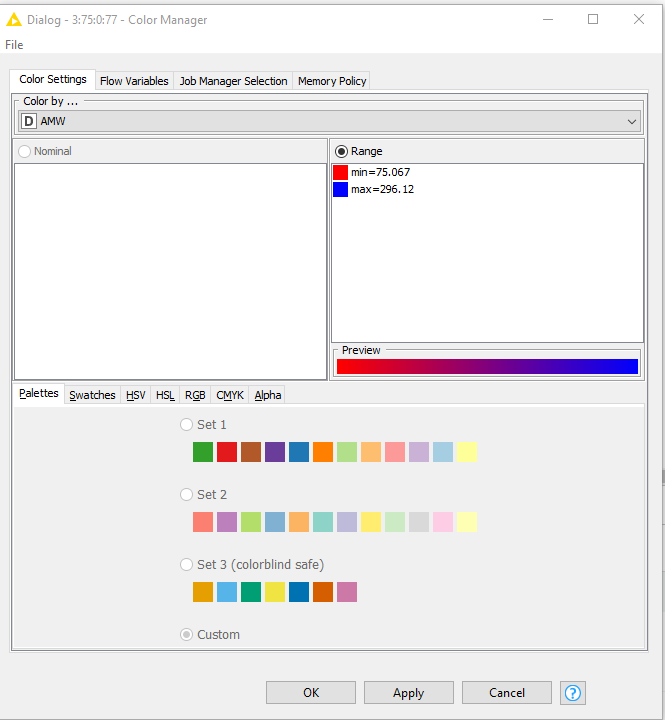
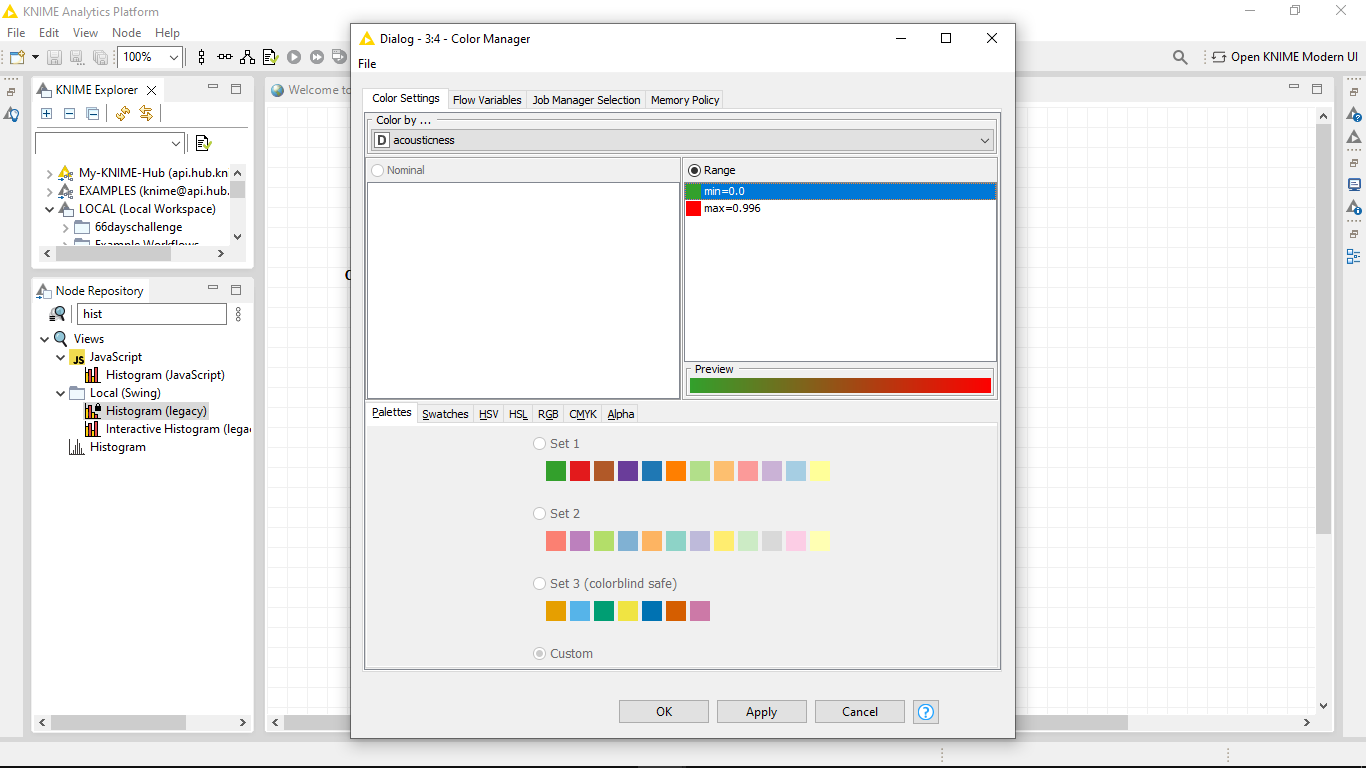
I tried using the color manager but that didn’t seem to have any effect and still showing blue color.

Can you attach the image so that I can tell where to change the color settings?

Referencres:

This is the histogram configuration:

which I didn’t see any option to pick a color.

This is the option in the color manager:

which I also didn’t quite understand how to use in the content of a histogram.

This is how the nodes are connected at the moment:
image

Histogram’s leagay node
I changed the color of the selected column.

In the color manager node, select the min and max.


Thank you for your help hapisnake. It’s interesting that this only works for the legacy node.

1 Like

Hey @likhangy,

The new Heatmap and Histogram currently don’t support the coloring. We will add it in the future. There is already a ticket for it (internal reference UIEXT-1688), but currently no timeline, yet. I will update this thread as soon as I have more details.

Greetings,
Daniel

3 Likes

Thank you for the reply, Daniel. Really appreciate all the work the KNIME team has done.

1 Like

This topic was automatically closed 90 days after the last reply. New replies are no longer allowed.