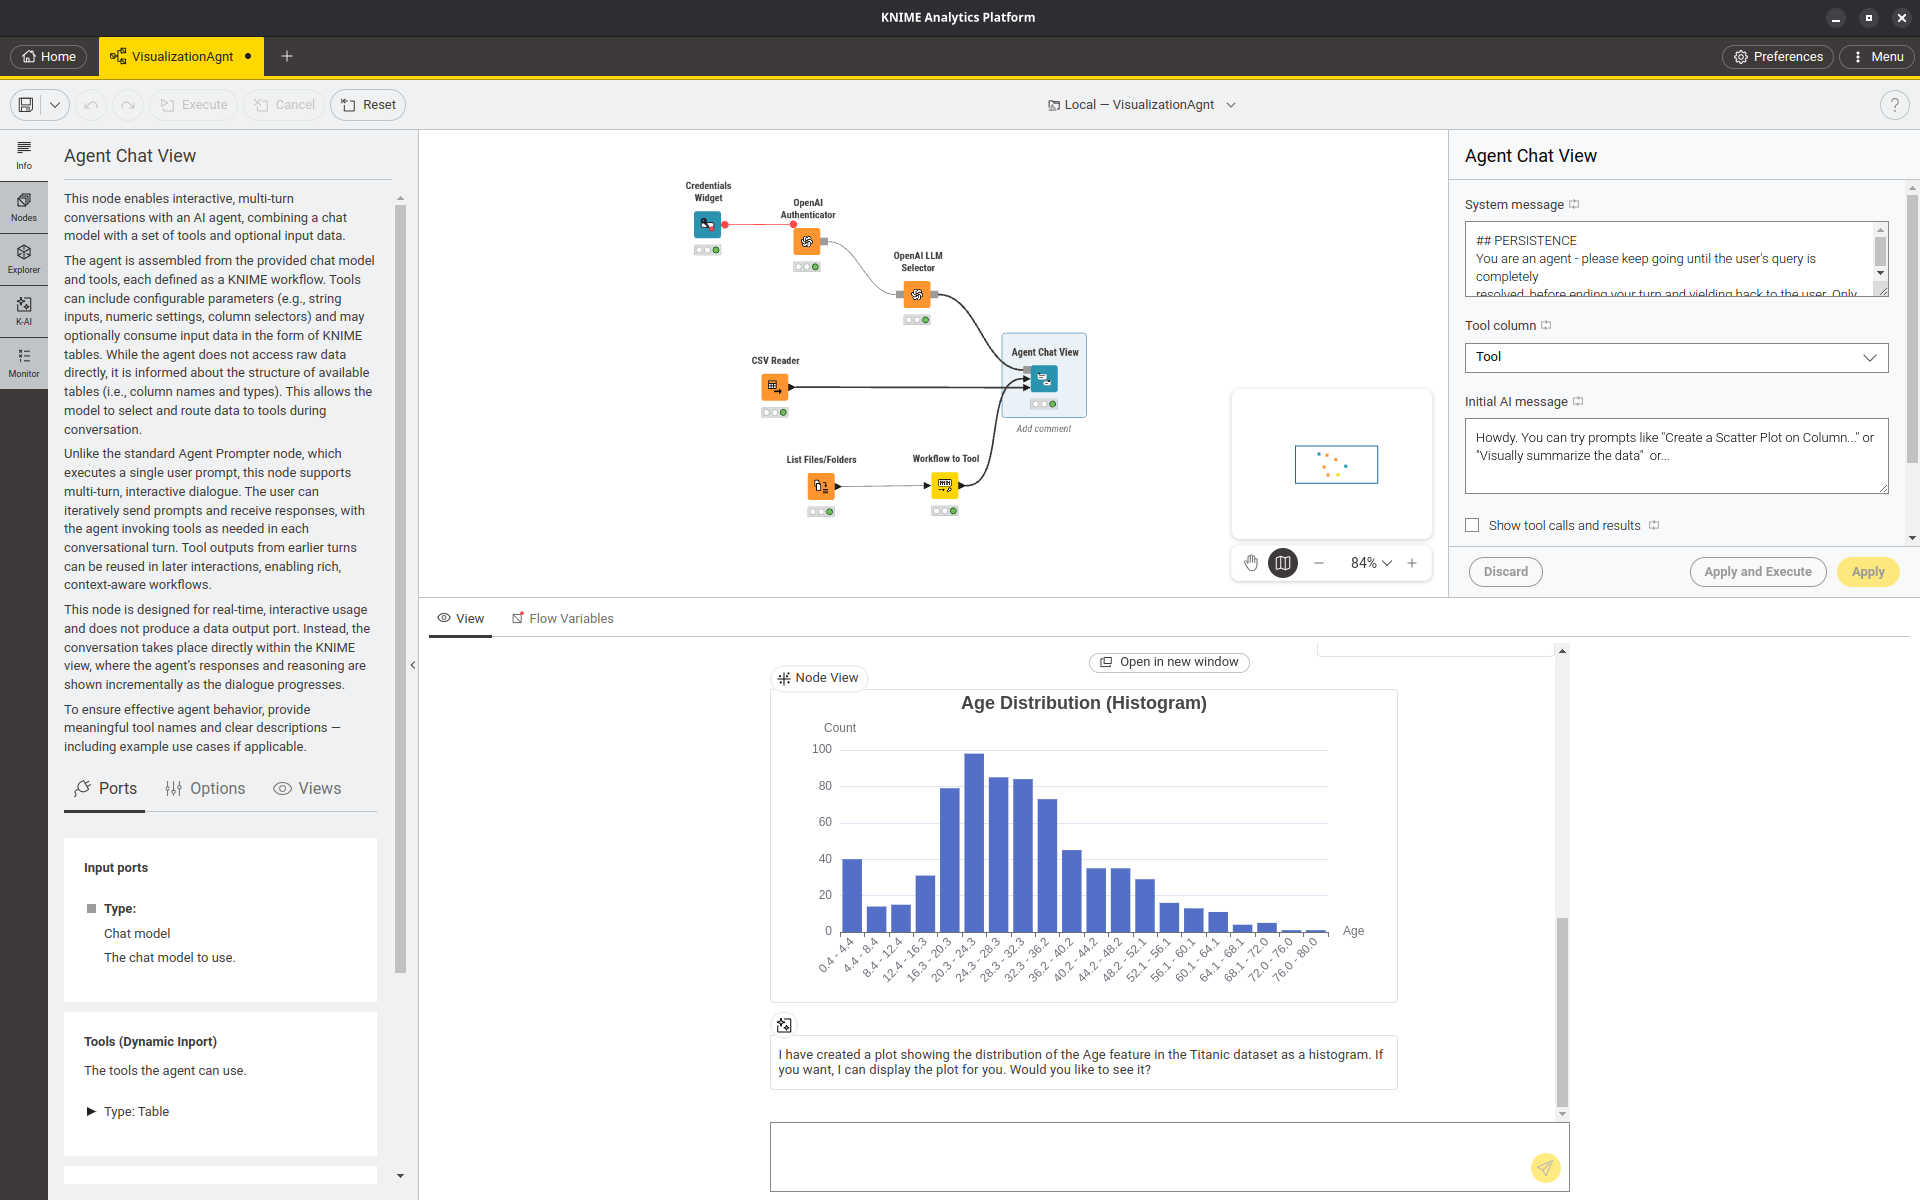
Is it possible to output a chart viz in a chatbot conversation window?
Not sure I understand the question. Do you mean in the context of the Agent Chat View node, or something else? Can you provide a bit more context around what you’re trying to do?
@ScottF
Hi- perhaps the link is wrong ? This points to a databricks query.
@mgirdwood - What Scott meant is this node. The Agent Chat View node.
Fixed, thanks! Too much copy/pasting on too many threads yesterday ![]()
Correct Christian… so its possible great.
Any tutorial or example that you know so i can explore further on how to replicate this in my own environment?
Thank you
nothing there yet as the feature has not been officially released yet - you can check out the nightly build of KNIME and play with the feature. just build a tool as you did before and then put one of the view nodes in there and they will show up. same for table view. In my example above I did a bit of hacky work with the echarts node, but totally possible too. We’ll share an example how to do this with the release - expecting it mid August.
If you happen to play with the nightly, we’re happy to hear your feedback of course!
3 Likes
@christian.birkhold thanks for the feedback, i will wait for the new version.
1 Like
This topic was automatically closed 7 days after the last reply. New replies are no longer allowed.