I have a data set comprising of a couple of hundred thousand lines of picking transactions. Each of the items picked is identified by a distinct, individual SKU number and in categorised according to its characteristics - meat, fish, produce, homeware etc. There may be several hundred transactions picking the same SKU.
I have noticed that a few transactions have anomolas category allocation - eg an item that usually categorised as say meat, comes up as fish - I’ve spotted a couple in the first couple of hundred lines, but obvs can’t go through 200k by eye
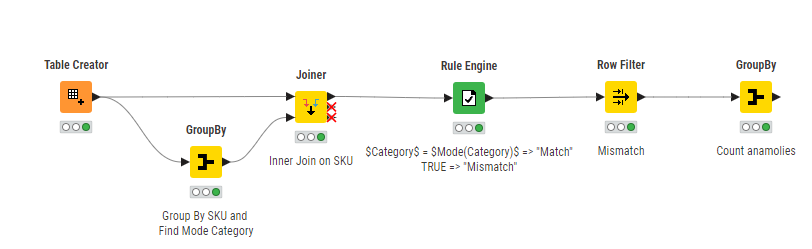
Is there a way of comparing the SKU column with thecategory column and returning a count of the anomolies and/or the row numbers where the category and SKU do not match the mode?
Don’t think there is anything that does that job out of the box.
The way that I’d start tackling this is checking the “unique” SKU => Category pairs in your data. Simplest way to do that is by using GroupBy Node and select SKU and Category Columns as Group Columns. Might be worthwhile to add any column as aggregation column under Manual Aggregation tab with Aggregation Method Count.
Then add Sorter Node and Sort by Count Column Ascending. That way you get the SKU => Category pairs at the top that have the lowest count and therefore might be candidates for wrong allocation…
If you can get your hands on “Master Data” that maps any SKU to a valid Category that’d be even better and give more options.
Are you using the latest version on KNIME Analytics Platform.
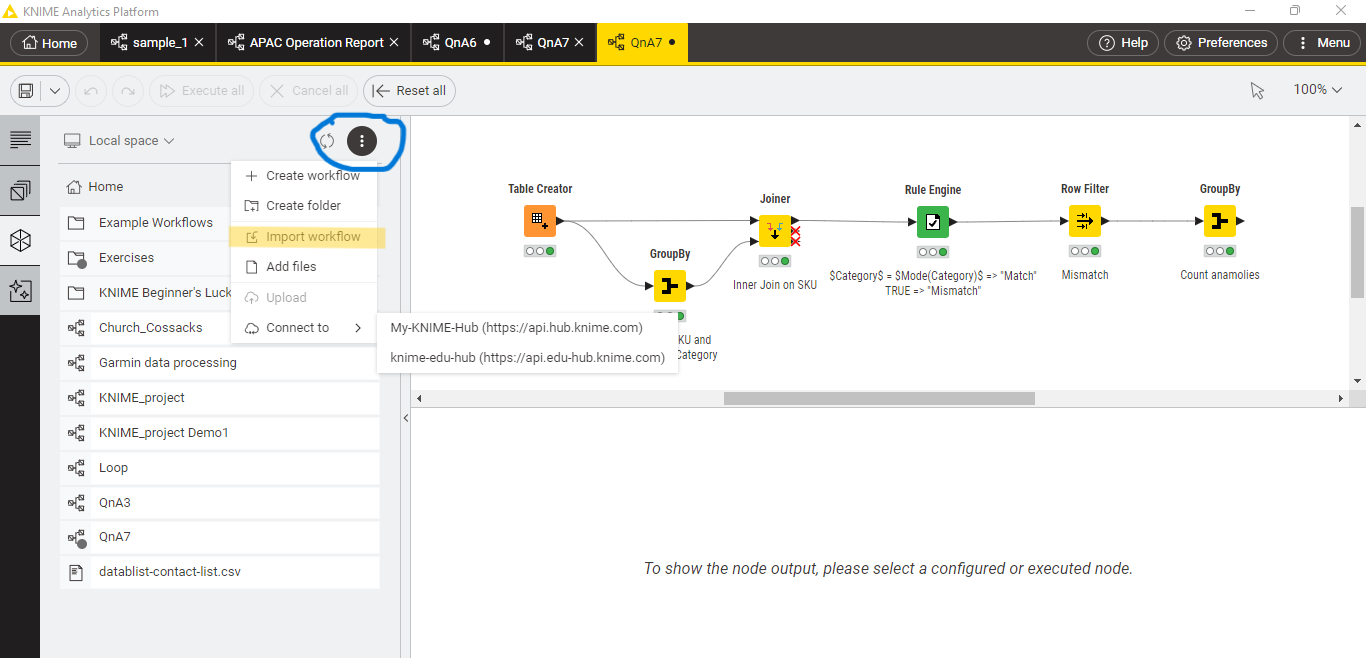
You just have to go to Space Explorer ----> Click on three Vertical dots -----> Import workflow
and the open it.
Yes the workflow contains same configuration as the image.
Happy to help.
If you are satisfied with the solution, you can mark solution as solved because this helps people get directly to the solution if they have the same or similar question.