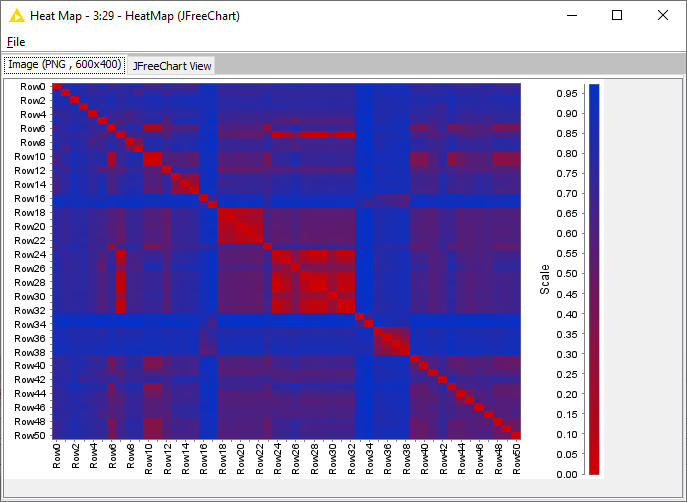
Hi all! I’m working on a data set and trying to make a tanimoto heat map of pairwise similarity. I would like the output heat map to have a grid like format, but currently all I’m getting is columns.
Would someone be able to offer revisions to my workflow that will get me my desired outcome?
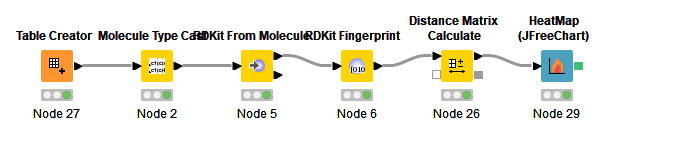
Let me know if you have questions? I’m attaching the workflow and the initial data set Intro to Heatmapping.knar.knwf (43.6 KB)
You didn’t include any data, so it’s hard to figure out what the issue is.
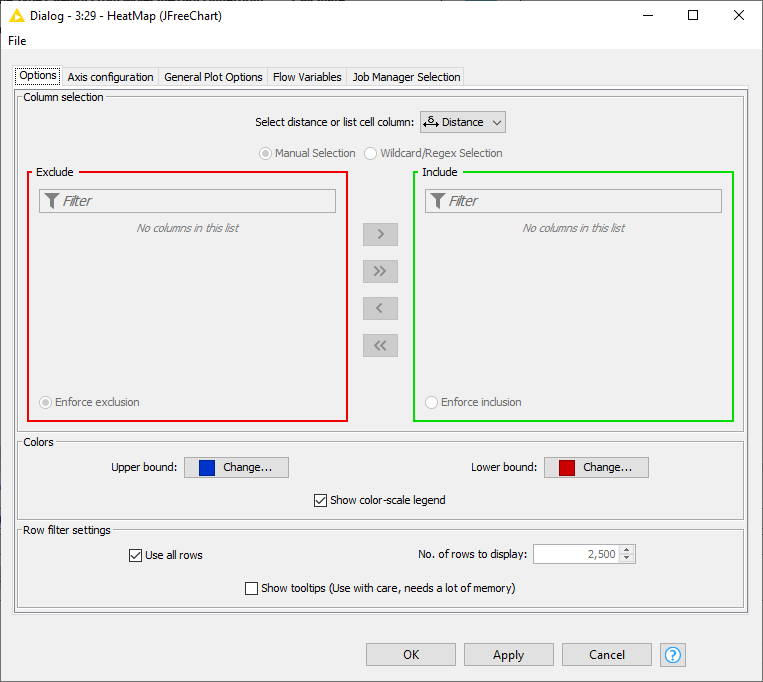
My guess is that you’re not supplying the HeatMap node with the correct inputs. The key is in the description for the HeatMap node you chose:
A HeatMap visualizes a matrix by coloring each entry of the matrix with a color scale. For generating the HeatMap a column of type DistanceVector or ListCell has to be selected from the input data.
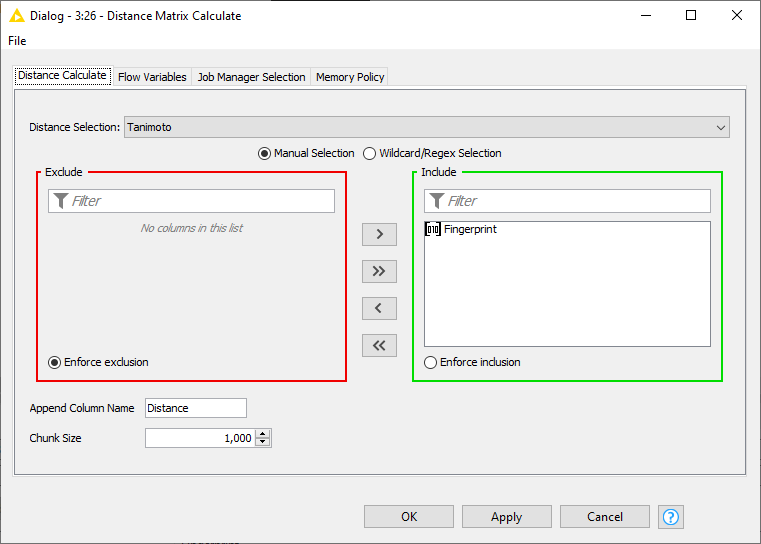
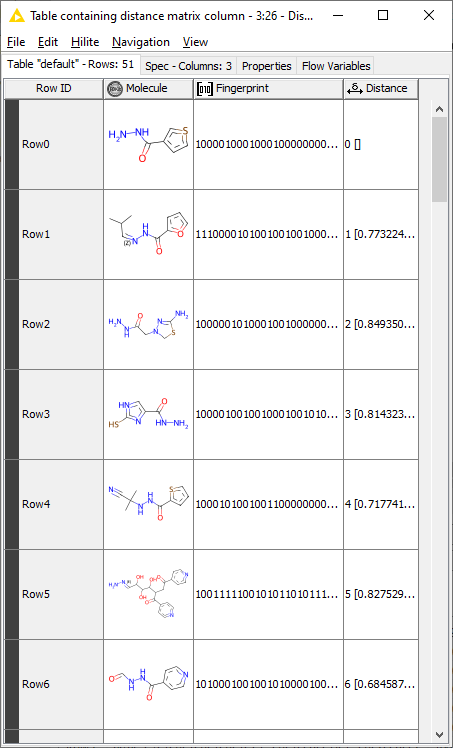
To get a column type of DistanceVector, I’d just use the Distance Matrix Calculate node.
Hi! I was able to generate the desired heat map. Thank you for sharing this workflow. Feel free not to respond, but I have a followup question. I had been advised to perform a similarity search as a starting point to generating the heatmap. Would you be able to explain to me a bit further why that method prevented my from getting a heatmap that the distance matrix calculate node forms?
Hi @fath1,
in the future, please add your data files to the data directory of your KNIME workflow, and read it as relative to current workflow data area. In this way, you can also share the data with your workflow, which makes it easier to work with it.
Here are some explanations on why the matrix didn’t look like you expected:
In the similarity search, you keep only the closest three molecules (setting Neighbor Count: 3). So you end up with 3 columns (which are not always the same molecule, but for each molecule you will have the distance to the three nearest molecules). Here, I would use "similarity (1 - distance) by the way, unless you really want to visualize the distance?
So to change your workflow to show the similarities of all molecules, you would need to increase the neighbor count to the number of molecules you have.
Also, at the moment you use the nearest neighor - index for the Pivoting (which just tells you that this molecule was found at the first, second, third,… place), I guess you would like to have a heatmap of molecule vs. molecule instead. To do this, you can set the representative column (2nd input) in the output options of the similarity search to your smiles column.
The last point: I’m not sure why you calculate the mean of the distance/similarity values with the GroupBy node. Do you have duplicates in your data set that make this necessary?
Given that you need several nodes to do this, I suggest to use the Distance Matrix Calculate node as @elsamuel suggested instead. Please mark his post as solution!