I use the Color Labeling Node in order to get a colored picture of my tables, but it does not let me choose the color i want to color my cells in.
Is there any way to do this?
Hi @Landerhe,
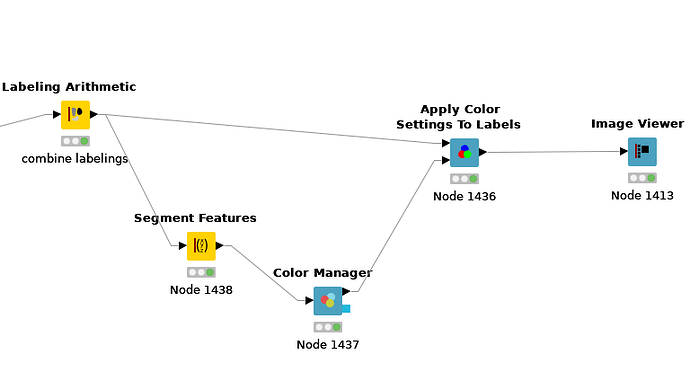
I am sorry I did not answer that question in your other thread, you can set the color for the Labelings using the Color Manager node in combination with the Apply Color Settings To Labels node. To be able to use the Color Manager on the combined labeling you need to extract the single Labelings with the Segment Features node:
The problem you will face though, is that the Image Viewer will mix these colors when labelings overlap. I found a solution so that you can set the color for each combination of labels, see the attached workflow:
Fluerescence-coloring-v2.knar (596.1 KB)
It takes advantage of the Image to Labeling node to extract the different labeling combinations, this is a bit hacky but it works 
best,
Gabriel
Dear Gabriel,
thanks alot for your help i finally got my whole script to work the way i intended it, which enables me to quantify my microscopy data for my thesis. So thanks for that 
The only thing left now is to loop the script for a whole set of tif files 
Best,
Henrik
Do you by chance know how to export an image? I have been able to export the table with the excel writer, but am unable to use the image writer as there is “no image column available”. I could use the snipping tool of microsoft but that does no seem like a very good idea.
Best,
Henrik
You can use the Labeling to RGB Img node to transform the labeling into an image that you can write with the Image Writer node. There you can even set a background image (e.g. your original data).
best
Gabriel
I have one more issue… sorry
When i use my controls, which are only positive for one fluorophore the Labeling Arithmetic note does not work, as the completly negative data only shows as a ? in the column and the combination of both labels does not work. Is there any way around this?
Best,
Henrik
You might need to route your controls differently through the recoloring part of the workflow. But I think there just might be a bug in the workflow that leads to invalid handling of an image if it does not show any activity for a fluorophore.
The “?” symbol represents the Missing Value maybe you can investigate where this is created? Then we can try to fix that together.
best,
Gabriel
Yes, the issue is that when a channel does not show any signal there is no output for a positive cell, which results in an empty column at the joiner node before the labels are merged. Is there a possibility to just set a blank label (just a full negative picture) of the channel if there is a Missing Value, so the pictures can be merge without any issues?
The general script is working just fine the only issue is that the notes cannot be executed if there is no positive data/the missing value.
I cannot use a different route with my controls, because I will also have experiments where I use very low doses of my constructs, which sometimes also results in no positive cells for some fluorophores.
By the way thanks again for the continues help 
Can you upload such an image + your current workflow? I got an idea I would like to test on how we can handle this. We just need to create an empty labeling for those cases where the response is too low.
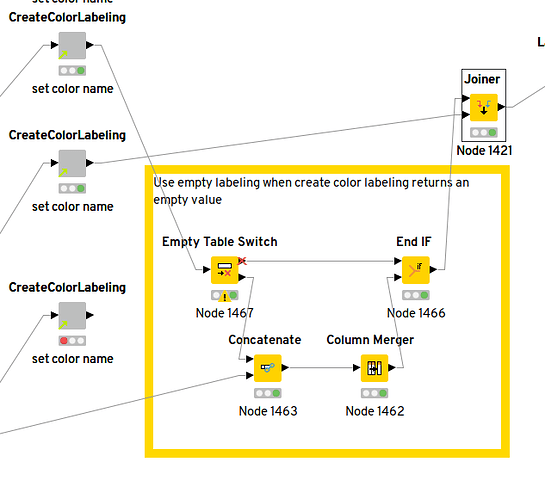
I was resolving cases like this in the past by using the Column Merger node:
- Let’s assume you have two labelings, L1 (defined for all rows) and L2 (with missing cells)
- Row Filter the table to contain only rows with non-missing L2
- Perform the merging using the Labeling Arithmetic
- Join the output table back with the original table (using an outer join on the original to keep all rows)
- Use the Column Merger node to take the L1+L2 labeling where present, and L1-only otherwise.
Hope that helps.
Henrik_Workflow.knwf (474.3 KB)
Project_103.zip (2.8 MB)
Here the workflow i am currently use and a dataset where only 1 of the channels has a positive signal.
The issue is that i have 1 row with 2 columns, each containing one microcscopy channel. For Data that has positive cells for all chanells the script is working fine, but if one is missing the missing value is messing up the script.
I not really filter my 2nd row as it has exactly one value, that is missing if no signal is present.

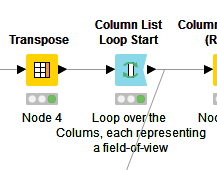
Why are you using Transpose and Column List here? I’d assume that column-wise processing gets highly inefficient when working with a higher number of fields of view. KNIME is optimized for row-wise processing (and you can even parallelize that). Why not keeping the channels in different columns and process them as such, with one row per input image?
I still think my solution with the Column Merger would work, at the time of where the missing labeling is (not) created. But your workflow is far to complicated and I don’t have time to dig in. Maybe @gab1one can help, or you can provide a more simplified, minimal example workflow?
@imagejan thank you for the column merger idea, I combined it with an empty table switch and the annotator to create the desired result:
Henrik_Workflow_TGYS_Try-with-empty-value-handling.knwf (523.0 KB)
best,
Gabriel
This topic was automatically closed 90 days after the last reply. New replies are no longer allowed.

