Hello all,
I have a task to do for a school project, but I am a newbie with Knime.
Main task is to prove or disprove the following claim:
Customers can be clustered based on where they shop the most.
Decide on which columns to perform clustering to best analyze the question.
Decide on algorithm/library to use.
Provide graphically the clustering results to demonstrate if the claim is true.
I removed the empty fields with Row Filter. I also noteced that there is a incorrect values in the dataset like “max_distance_to_shops” column, but I can’t find a way to filter them. I am thinking about using IF construction in Row filter. Also I am unable to decide which column/s should I use for clustering the data.
I will be very thankful if someone could help me out.
There is a dropbox link for the dataset below:
So as I see it, you have two issues here: first, you get the wrong data types if you try to load the file into KNIME. And second, you wonder where to continue if the file was successfully loaded.
1 - what do you undertand by
? Do you have a wrong data format? Are there some “absurd” values? It would be helpful if you would provide some additional information.
2 - so you just filtered out rows containing missing values, right? If it’s for a school project, do you need to provide a reason for that? There are two additional options available: with the Missing Value node, you can replace missings with many different methods (mean, median,…) (or you use even more advanced missing imputation methods which are not covered by the Missing Value node), or you could use clustering algorithms which are able to deal with missing values, which leads me to the next question…
3 - which clustering algorithm are you bound to use / do you intend to use?
4 - what is your strategy to decide for columns to use? Is there an upper/lower bound? Do you know that there are the Feature Selection Loop nodes which could help you with that?
5 - for the graphical representations, I personally am a big fan of the 2D/3D Scatterplot node (Erlwood), where you can display up to 5 dimensions in just one picture (classical 3D + colour + dot size) or, but that might be too advanced for a school project, the parallel coordinates plot, where the number of dimensions is unlimited (theoretically)
Hope these questions do not overwhelm you but rather guide you in your project!
The most what?
“products” (based on number of purchased products in each shop)
or “amount” (the total money they have spent in each shop)
I could also ask if you mean the most “often”, but the number of visits is not included in your dataset so obviously it’s out of interest.
Hi @Alec,
Thanks for the fast reply. I am loading successfully the dataset. But there is a emty row so i removed it with Row filter. It is not mentioned that it must be replaced ,so i decided to filter it. In column “max_distance_to_shops” is the maximal distance of
“distance_shop_1,distance_shop_2,distance_shop_3,distance_shop_4,distance_shop_5”
For the first row “max_distance_to_shops” is 4082.522 but it must be 4929.805. The maximal for this row is in column “distance_shop_4”. So I don’t know how many rows are incorrect and i suppose that they also must be corrected.
About the clustering algorithm - it is not specified. I was thinking about K-means. But I am not sure how to proceed with K-means.
About the colums to use - it is also not specified. I was thinking about using colums min_distance_to_shops,max_distance_to_shops also amount_purchased_shop_1, amount_purchased_shop_2,amount_purchased_shop_3,amount_purchased_shop_4,amount_purchased_shop_5 to find out which shop has the most sales.
I will be very thankful for advices, examples for solving the task.
Sorry for the delay.
Regarding your dataset and the question, I assumed that “the most” here means the most amount of purchase which is the total money paid by the customer.
Now, the first thing you can do is to find the top shop in “amount” value. Just to specify the top shop for each customer.
But to answer the question, you have to check which attribute(s) has the most impact on “amount”. By “amount” I mean the 5 columns named “amount_purchased_shop_#”.
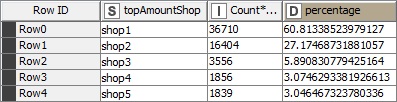
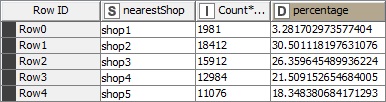
So, I did some aggregations to find out what makes customer to buy from a shop more. The only available variable here to investigate is the distance. But when I checked this variable, found out that the distance to shop itself has nothing to do with the amount a customer buys. Why? Because although 60% of the customers has the shop 1 as the top shop in amount, only 3% of them have the shop 1 as the nearest shop to them.
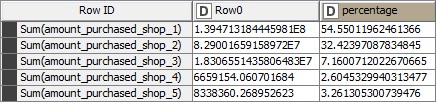
The sum of the amount sold in each shop is almost the same as the top amount for each customer:
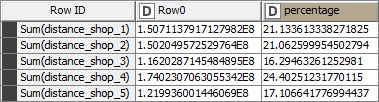
And as you see the sum of distances to each shop does not have a significant difference:
Now the question is why people buy the most from the shop which is not the nearest?
Perhaps the reasons are: Being the first store in the chain (more reputation), being the biggest one (more available products) and being in the city center (the least avg distance).
From the shop numbers in the dataset we can infer that which shop was operational sooner and has more reputation (more reputation = more amount). So the first shop in the chain is the shop 1. Even if this assumption is wrong, it does not matter since we just relate the shop number to the amount sold based on dataset. So one attribute can be the shop number, but although this number has the order (the shop 1 is higher than shop 2 and so on), it does not have the distance. Here we can convert the amount to shop number so the distance can be measured as well as the order.
The shop size or available products cannot be inferred from the dataset (maybe the unique product has some meaning related to this but I do not trust that). So the second attribute (how big a shop is) has nothing to do here.
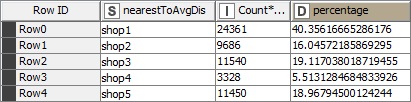
Now the third one. Being in the city center or let me say it in a better way, being the nearest to the customers in average. Here we can calculate the distance to the average distance which somehow makes sense regarding the results:
First, I have calculated the difference between the distance to each shop and the average distance and then selected the least one as the “nearest to average distance”. As you can see, the most percentage of customers (40%) have the shop one the nearest shop to the their average distance.
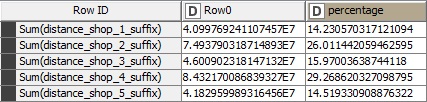
I also calculated the sum of this distance for all the shops:
As expected, the shop 1 has the least total distance to the average distance. The shop 5 is in the second place which makes me infer that perhaps the shop 5 is also somewhere near the city center.
As a conclusion, I think you can use the two available attributes I discussed here (the first and the third one) to cluster the customers.
I suggest using XMeans and Weka Cluster Assigner for clustering because it’s easier to deal with the number of clusters.
I also built a decision tree model based on these attributes and got a very good evaluation score.
I do not provide any workflow since it’s your course project. But all the information you need is provided.
Dear Armin,
I am so happy with the explanation. And it helped me a lot.
But unfortunately I have no experience with KNIME, and I don’t have materials to study from to solve the task. I am using youtube examples, but the also don’t help me a lot.
Firstly I am loading the csv file with file reader, after that I am filtering missing values with row filter. But next i tried to group customers by nearest to average distance shop but i am can’t do it correctly.
I will be very thankful if you provide a workflow or a part from the workflow, because I am unable to proceed…
To find the top shop in amount the nearest one to average distance for each customer you can use Column Expressions node.
That’s so easy. You have to find the top amount and the least distance to average (Using min and max functions) and then check to which shops these values belong (if-else expressions).
Then you can use Math Formula and GroupBy node to produce the tables I shared.
This is really straightforward. Do your best and ask your questions again.