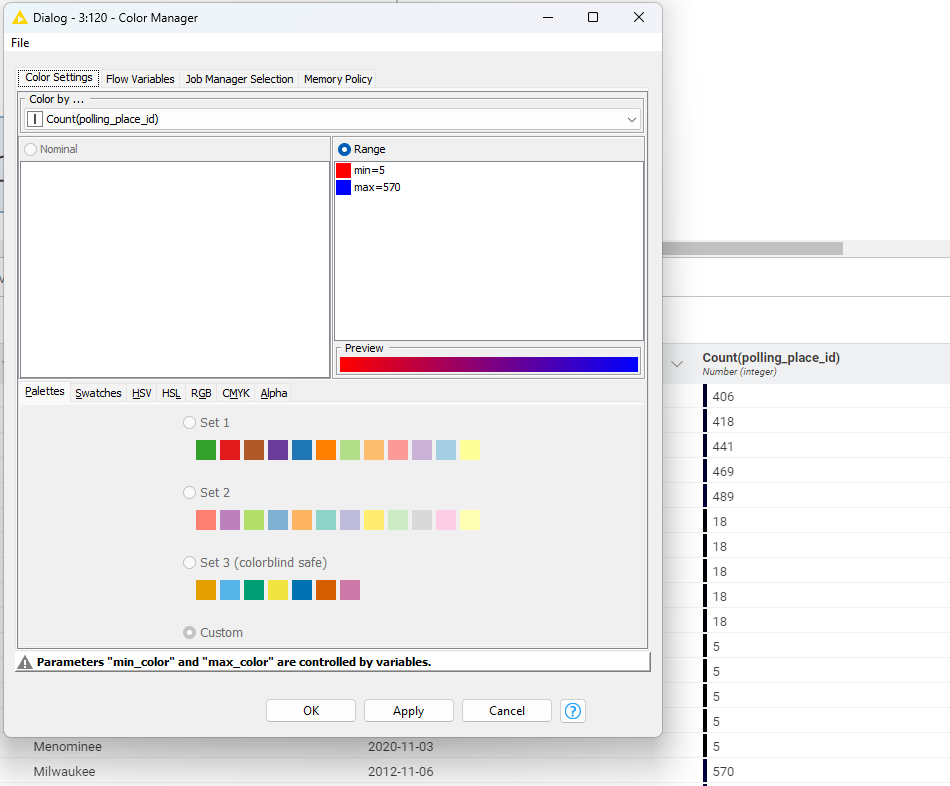
It seems, I am not smart enough with respect to colouration of graphs. I have applied a Color Manager node to my data and the data grid shows there is colour to the values. I can imagine that the black pole is just an indicator of colouration, but is not meant to reflect the actual colour to the value.
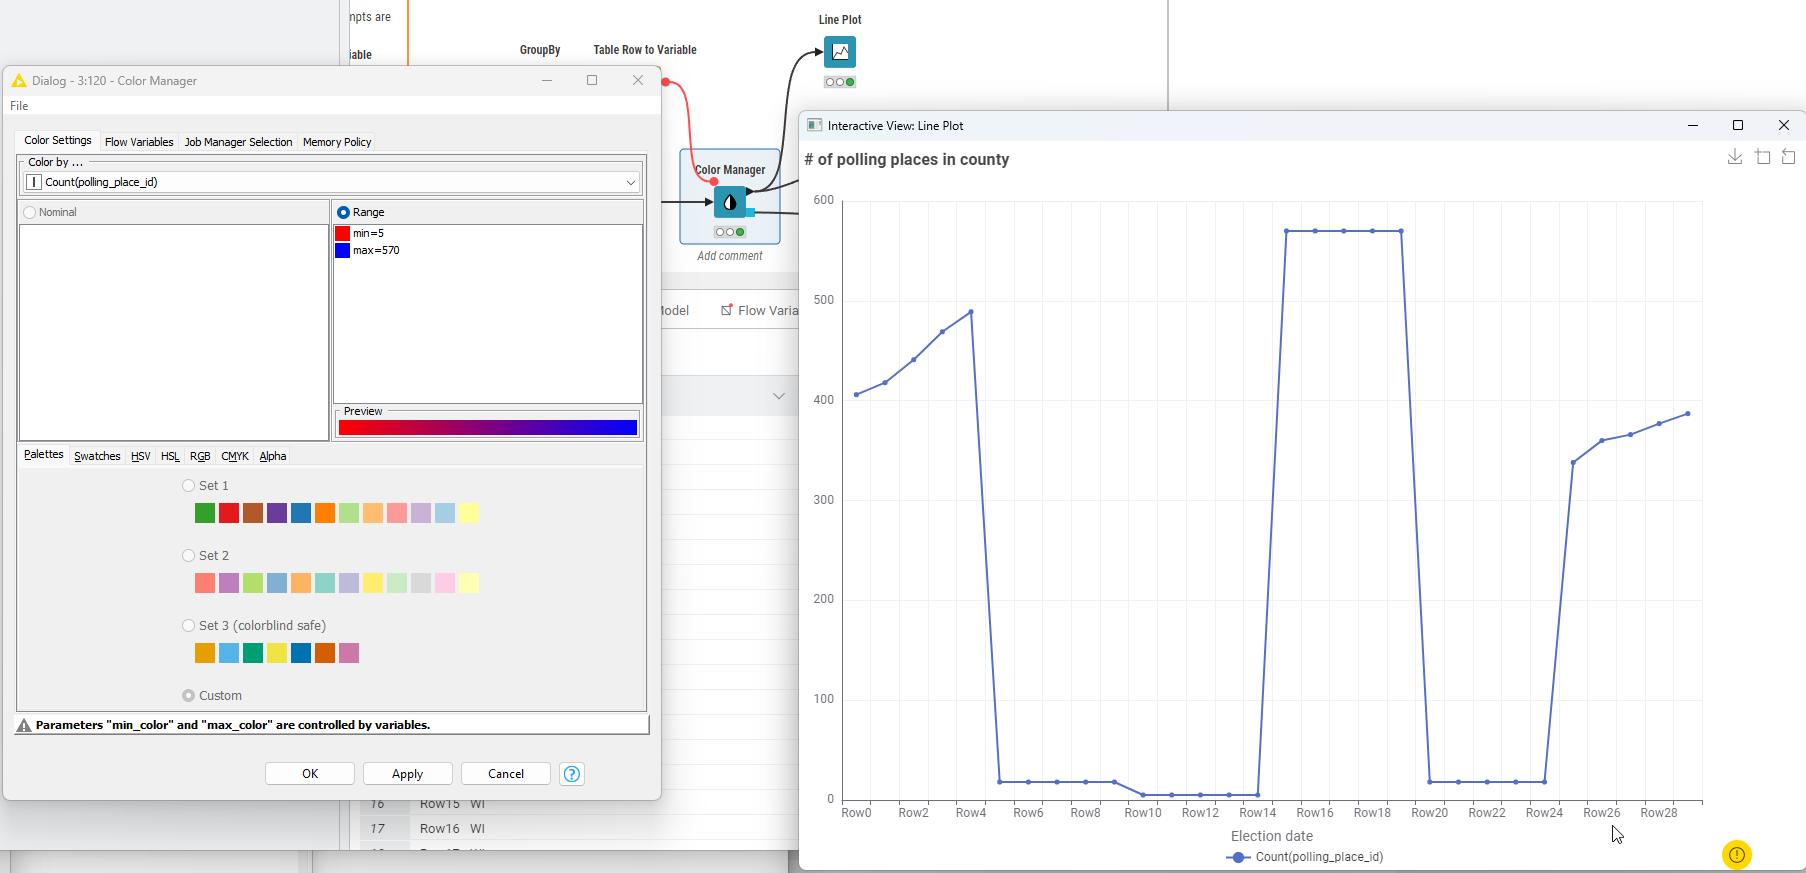
Possibly, the line plot node is not a node where colourisation can be applied. I could not find any hint in the description neither of the line plot node regarding colouration nor of the color manager node regarding which plot nodes can make use of the colour data.
The colors are set using flow variables and probably you have not used the correct values for min_color & max_color. You can set a color manually and ouput the settings as flow variable to see an example of correct value for the colors.
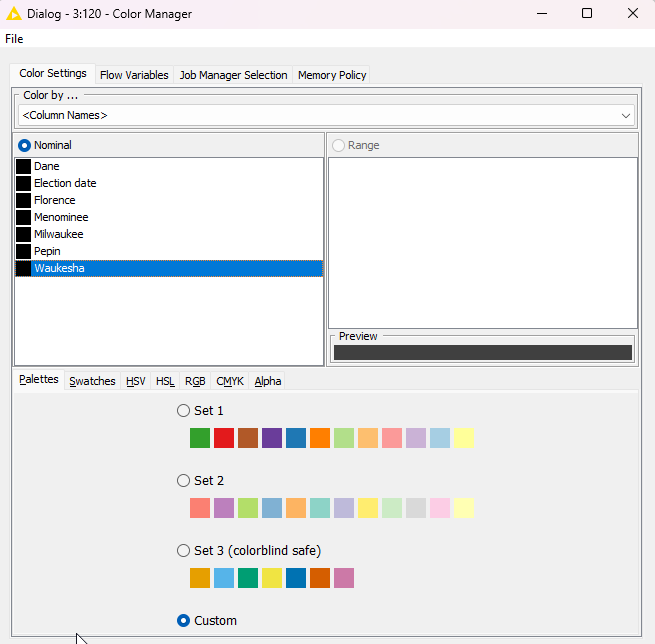
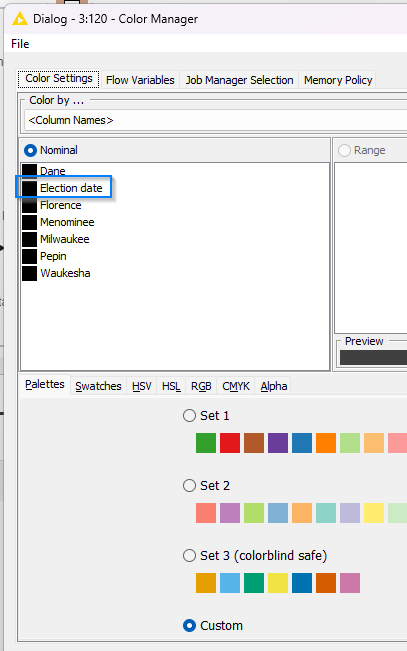
The Line Plot can be set to display “each line” (vertical dimension) with a custom color. For that you can select the “Column Names” option in the Color Manager node (under “Color by”). If you want to have a gradient along the Y axis, you can use the Generic ECharts View to have a custom view.
Thanks for your insights. I see, I missed adding a link to the workflow. Here it is.
Ad 1.: Is it not correct to extract the minimum and maximum value of the data and provide them to the Color Manager node as min and max respectively?
Ad 2. first part: I do not quite get it. Even without a Color Manager, I get different colours in the plot for the different data sets. Be it as that may.
As such, this does seem to me a bit awkward, but not a showstopper. However, all the axis are coloured black, not being the intention of this. Am I to interpret your last sentence in 2. (" If you want to have a gradient along the Y axis, you can use the Generic ECharts View to have a custom view."), that the Line Plot node cannot have the desired gradient but the EChart can?
Ad 2. second part: I have been fumbling around a bit with the generic ECharts view and have got a feeling that it is not dynamic in the sense, that when the number of data columns changes, the code of the node has to be adapted manually. If so, it seems to me impossible to use it in component views where one can change the number or name of the data columns. Am I mistaken?
The min/max values in the data are as column domain and you don’t need to specify this in the Color Manager setttings. The flow variable settings say min/max_color which means it needs the color code. If you assing a color and output the setting as a flow variable you can see the corresponding color code.
Yes, the view node applies default colors to the vertical dimensions (lines) if you don’t set custom colors.
Yes, currently, in case you want to assign colors to columns (not column values), it would be for all the columns.
You can change the colors for each column. Currently, you have selected custom and probably you used the same node you were using with the wrong color values. If you use a new Color Manager you will have each column with a different color. Or you can just edit the colors in the current node. For example, you can select one of the color sets.
Yes, All the KNIME View nodes are based on ECharts and you can create your custom view. The “opiton” object in the example code I provided is what you need to provide. If you find it not enough straightforward, you can also ask K-AI inside the node to provide the code. I think you will find it very interesting to build your own custom views using the Generic ECharts View.
It is possible. Using the base script, you could generate a dynamic script with other nodes and pass it to the Generic ECharts View as a flow variable. Or if you like scripting then I think @bwilhelm can help you with an even better approach.
I see, the min/max_color field controls the colour of the minimum and maximum value, respectively, and not at which value the minimum/maximum colour is applied. What colour coding is expected in the flow variables? RGB, e.g. 000255000 for green?
I am afraid, the dynamic Generic EChart approach is one or two steps too far for me right now.
This is the formula to calculate the number as integer based on RGB (Red Green Blue): Blue + Green * 2^8 + Red * 2^16
For example, if you have this RGB: 253, 215, 0 then: 0 + 216 * 2^8 + 253 * 2^16 as Int = 16635904