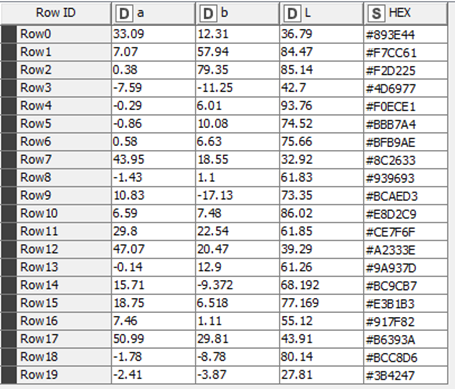
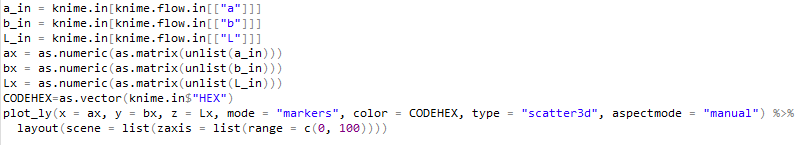
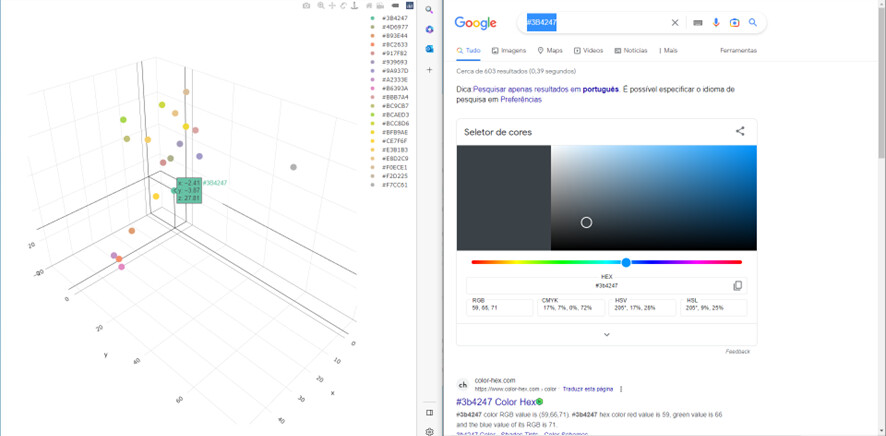
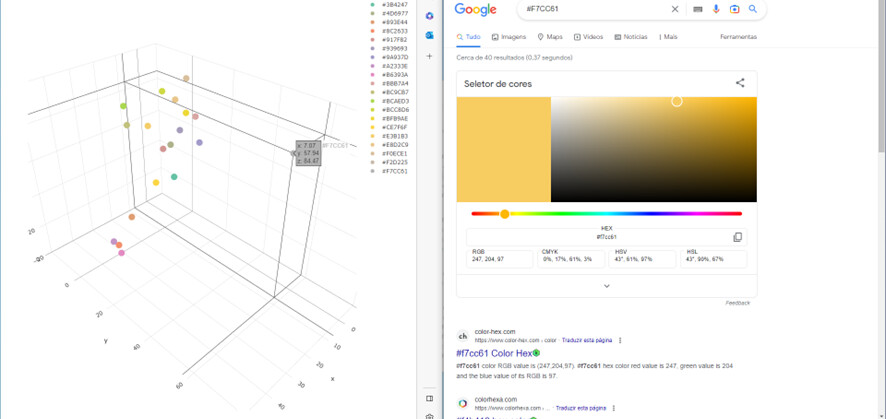
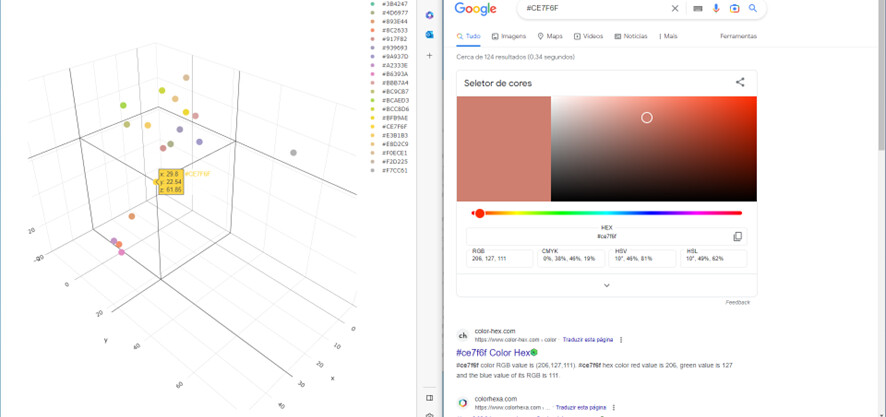
However, the colors that appear to me are not correct, because the color does not correspond to the indicated HEX code. I show 3 illustrative examples.
I am having issues installing your R packages to run your code in my KAP.
Side note: if you are trying to make a component for anyone to execute on their KNIME AP with your R packages you could use the Conda Environment Propagation node! I wrote here a short guide on a twitter thread!
Regarding your colorI had a look at this doc:
It looks to me that you are using the wrong attrbute: it should be colors = CODEHEX not color = CODEHEX! Plural! Let me know if it works.
For future readers I do recommend using the plotly node where no R knowledge is required. The color manager should work but you cannot add a custom list of HEX codes easily like @CatarinaCosta is trying to do.