Hi @alessandro_mac
I don’t know the level of interactivity that you need but, connecting your dashboard visuals in the right sequence; this is downstream from the the ‘Interactive Value Filter Widget’ node. The whole dashboard becomes interactive without need the function from ‘Refresh Button Widget’
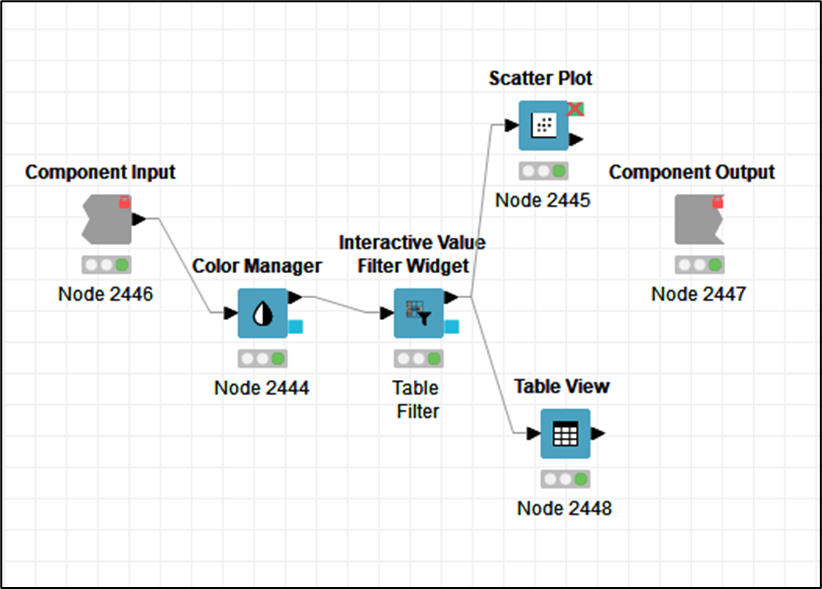
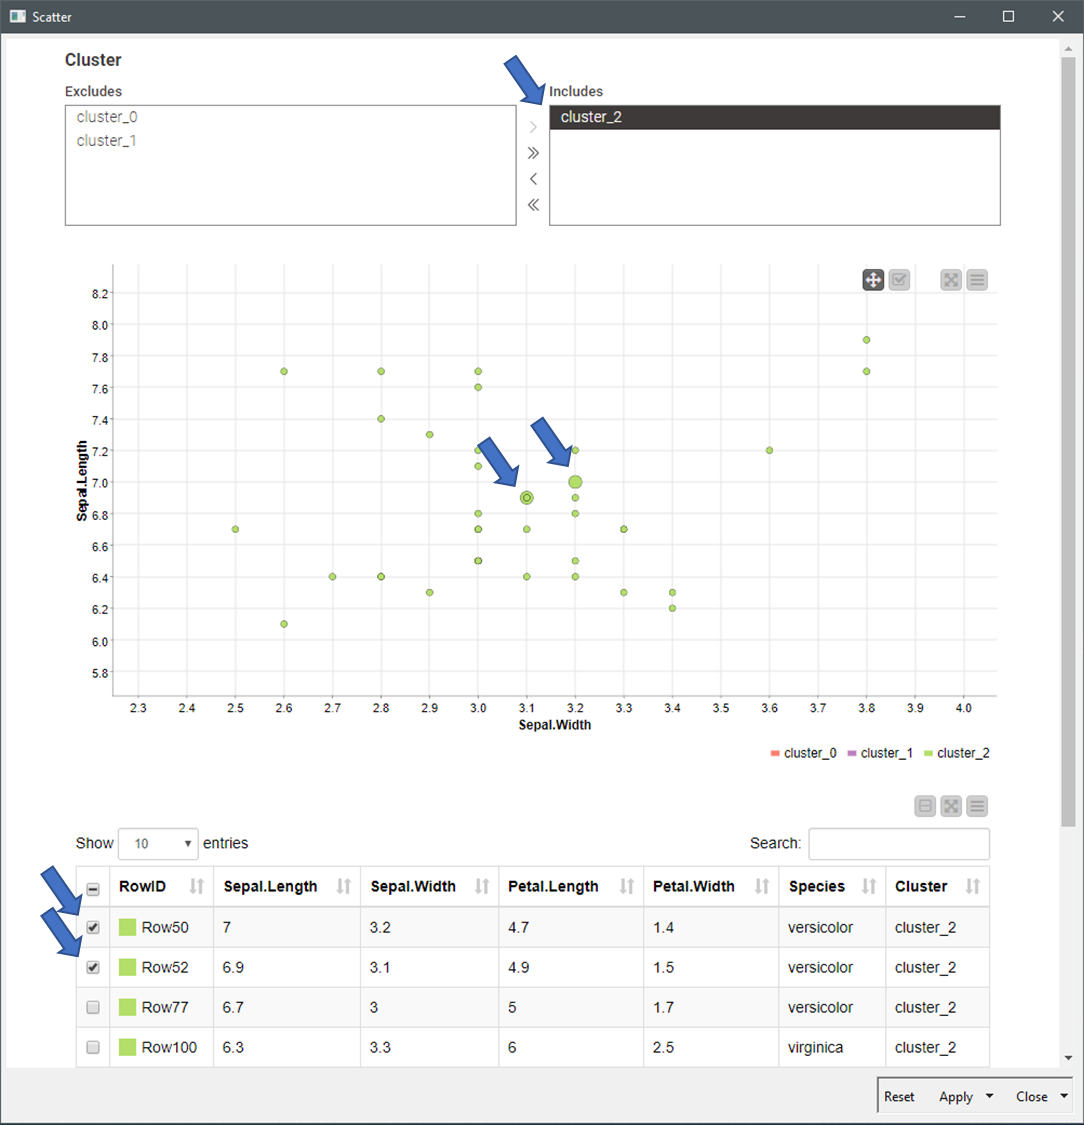
I’ve aggregated a Table visual to the dashboard. ‘Interactive Value Filter Widget’ filters the table, and element rows in the table can be selected and highlighted in the scatter chart (blue arrows).
20220922_plot_clusters_scatterplot_v3.knwf (98.8 KB)
BR