is there a way to change the color of the data points in a scatter plot (plotly) based on the selection of the data points themselves?
What I mean is: I have a scatter plot and I select some specific data points on it. As a result, I would like to see all the points selected colored with a certain color (example: red) and the rest of the points colored automatically in black, in a binary fashion.
I would like to have this feature on the same plot that I’m looking at.
Any idea on how I can achieve this?
Any suggestions would be much appreciated!
thank you very much for your answer!
That’s almost similar to what I’ve proposed, but using a twinlist instead of a list widget.
I’ll look into it as soon as possible, but just from the picture, it seems very nice also with the basic Scatter Plot. In my case, for interactivity purpose, I need the Plotly version but still, I can certainly apply the twinlist in order not to manually insert the values, so the user can just click and then, maybe, reload the plot.
That’s a big improvement to my workflow, thank you very much for your help!!
If I’m understanding you correctly, I don’t think there is a way to do what you’re looking for using the Scatter Plot (Plotly) node itself. But your component is certainly interesting!
I know there is a new version of the Scatter Plot in development but it doesn’t appear to support custom colors yet: Scatter Plot – KNIME Hub
Hi @alessandro_mac
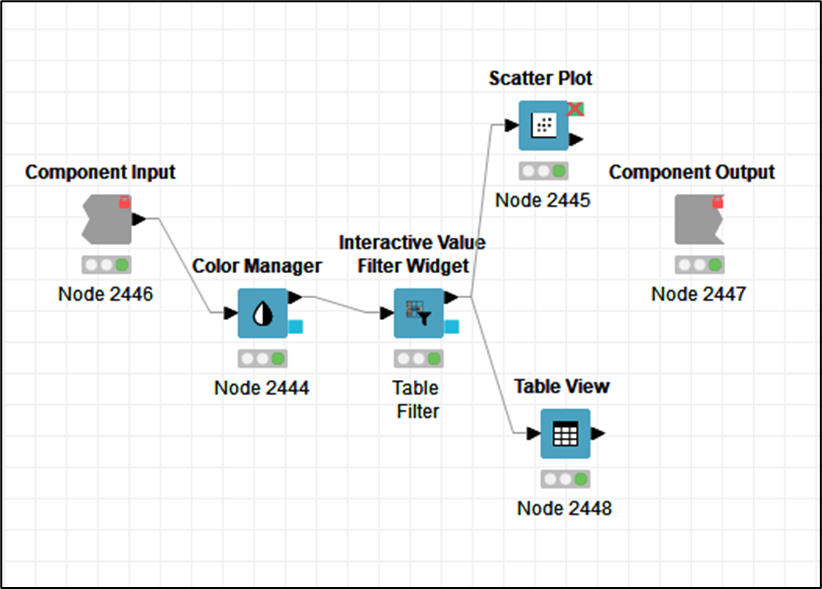
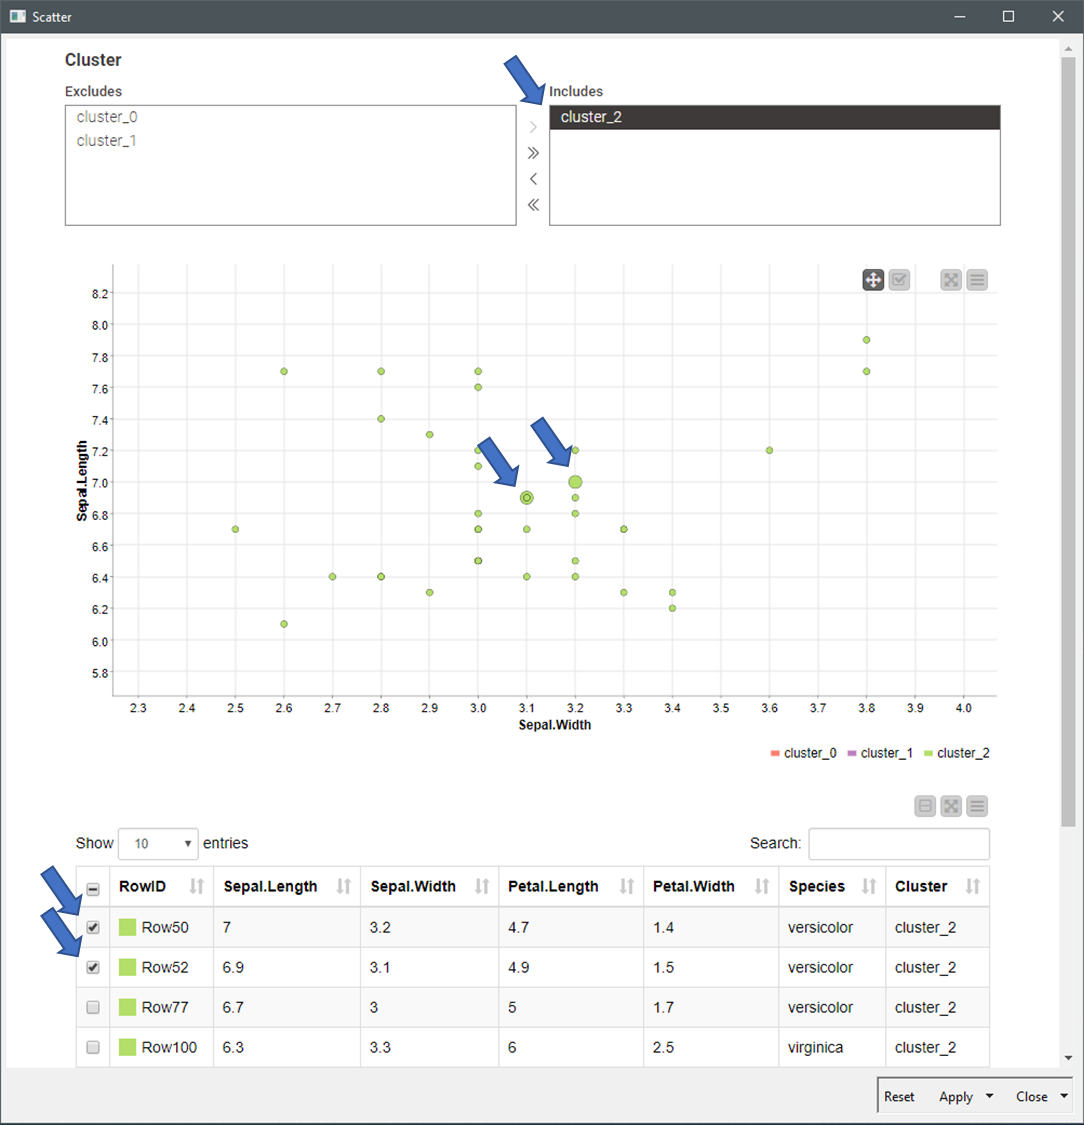
I don’t know the level of interactivity that you need but, connecting your dashboard visuals in the right sequence; this is downstream from the the ‘Interactive Value Filter Widget’ node. The whole dashboard becomes interactive without need the function from ‘Refresh Button Widget’
I’ve aggregated a Table visual to the dashboard. ‘Interactive Value Filter Widget’ filters the table, and element rows in the table can be selected and highlighted in the scatter chart (blue arrows).
thank you very much for your reply!
I’ve play around a bit and I’ve come up with two different solutions that work as a workaround to my problem.
The first one, called selectionPlot_V01, has the advantage of selecting the points inside the scatterplot just using a Multiple Selection Widget automatically re-executed as soon the list has changed (thanks to @gonhaddock for the suggestion of using the twinlist). The most important thing, in my case, would be to show all the points at the same time, marked and not marked together but in a way that you can understand the difference between them.
In the second one, called selectionPlot_V02, you can see three scatter plot:
the first one is a Scatter Plot (Plotly) version with points divided in bad and good types. Whenever you select the points in that plot and you click on the Refresh the selection in the plot button, you get the updated Scatter Plot as intended, with the specific points selected and separated in marked and not marked ones.
the second plot is a classic Scatter Plot: I left it there because I like the functionality of being able, whenever I select points in the first plot, to see them becoming bigger, already giving me a visual effect of separation between points. It would be really great if in the new version of the Scatter Plot that you mentioned, would be possible to also change the size of the points in a similar manner!
the third plot that you can see, the smaller one at the bottom, is there just because in case I try to hide it from the WebPage (unchecking it in the Configuration Dialog), the selection stop working correctly. It would be amazing to be able to hide it, without any consequence for the workflow. (Am I missing something here? Maybe the possibility to do that already exists but I don’t know it yet).
Any suggestions on how to make it better would be much appreciated!
thank you very much for your help, your idea showed me another way of approaching my task.
In my case I need to show all the points at once, the selected and not selected ones in order to show to the user a difference based on some kind of selection (from a list or from just selecting the points in the plot). Other than that, I also need some other information about the points themselves and, for my understanding, I can have that kind of information only with a Scatter Plot (Plotly) just hovering over them.
Again, thank you very much for your answer, it sparked another way of solving my idea!!
I’ve finally downloaded the Plotly extension and inspected your achievements within V02 component. Despite it isn’t perfect due to the interaction with the refresh button, you got colored your selection in plotly.
There are a couple of interesting features to learnt about interactivity within V02 component, and I’ve a couple of research pending. If I get into any improvement, then I’ll tag you to know.