I am producing spreadsheets from my Oncology Information System for the purposes of data QA. The spreadsheets have several columns that come from 4 parts of the GUI. I would like to colour the sections of the spreadsheet that come from the same place with a background colour to indicate where to look for the item to QA.
For example:
Columns named Gender, Pat_Postal, Birth_DtTm - all come from imported and displayed on the Demographics screen.
Columns named DxDate, Category, ICD10_M, ICD10_T, Grade, NodesTaken, NodesPositive, SizeMeasure, SizeUnit, P16, SUVp, SUVn - all come from the Diagnosis & Staging screen.
Columns named Course, CourseDate, Tx_Intent, Surgery, Ext_Rad, Chemo, Immuno, Hormone, Brachy - all come from the CarePlan screen.
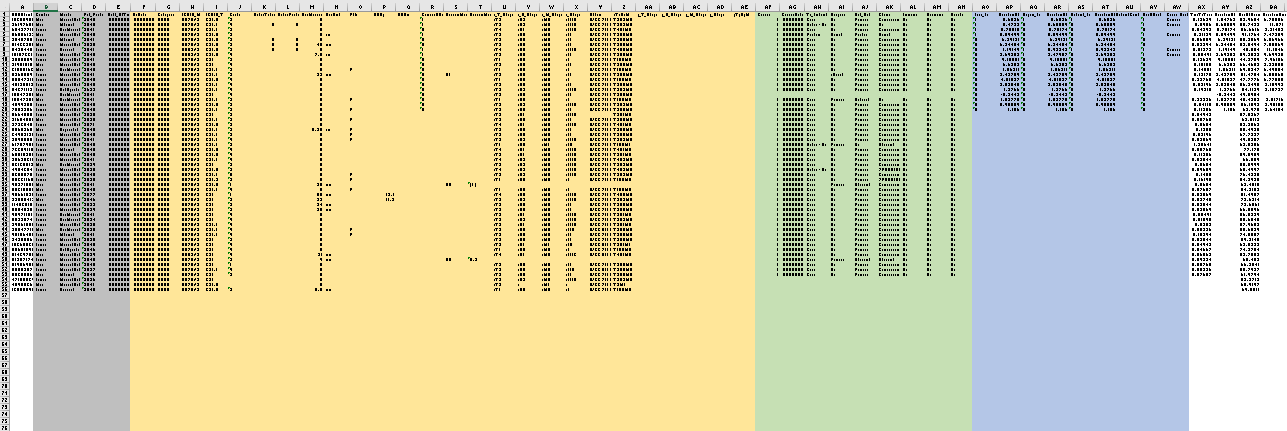
I would like to colour the entirety of background of all columns selected into one group (e.g., all the columns listed in the CarePlan group will have a background colour of light red). So that it looks like this:
I have looked at the colour options, and they are all for colouring things that match a particular value which seems to me to be a selective ‘row function’ (I was grateful to find this as it makes QA easier also in other contexts).
I’m expecting that I’ll be told “it can’t be done in KNIME at present”, but it doesn’t hurt to ask the experts. You haven’t failed me in the past.
Many thanks for taking the time to read. I appreciate your time, as always,
A