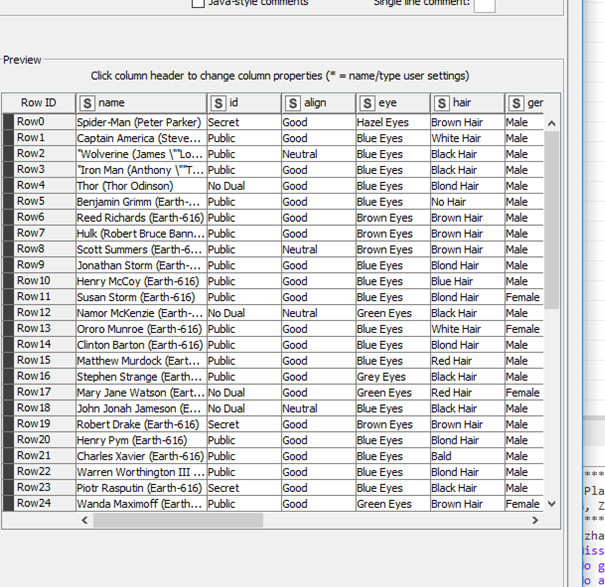
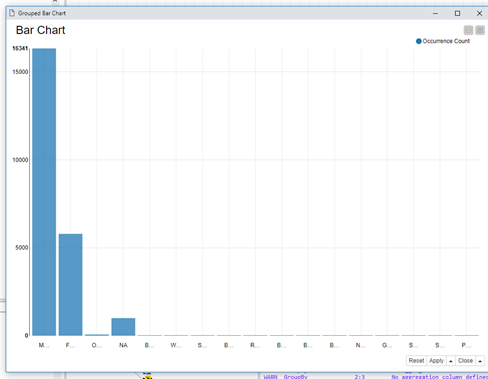
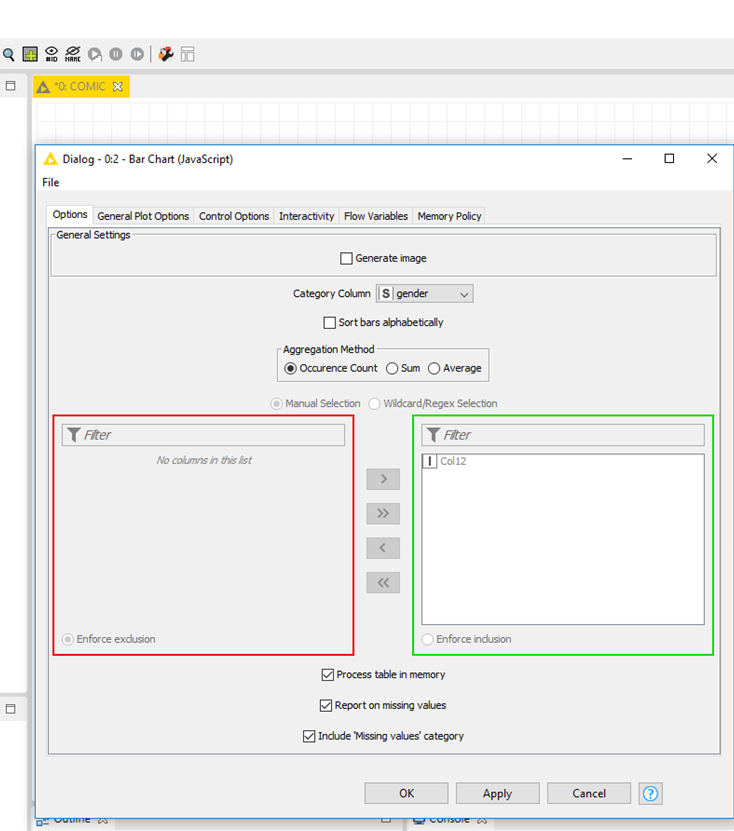
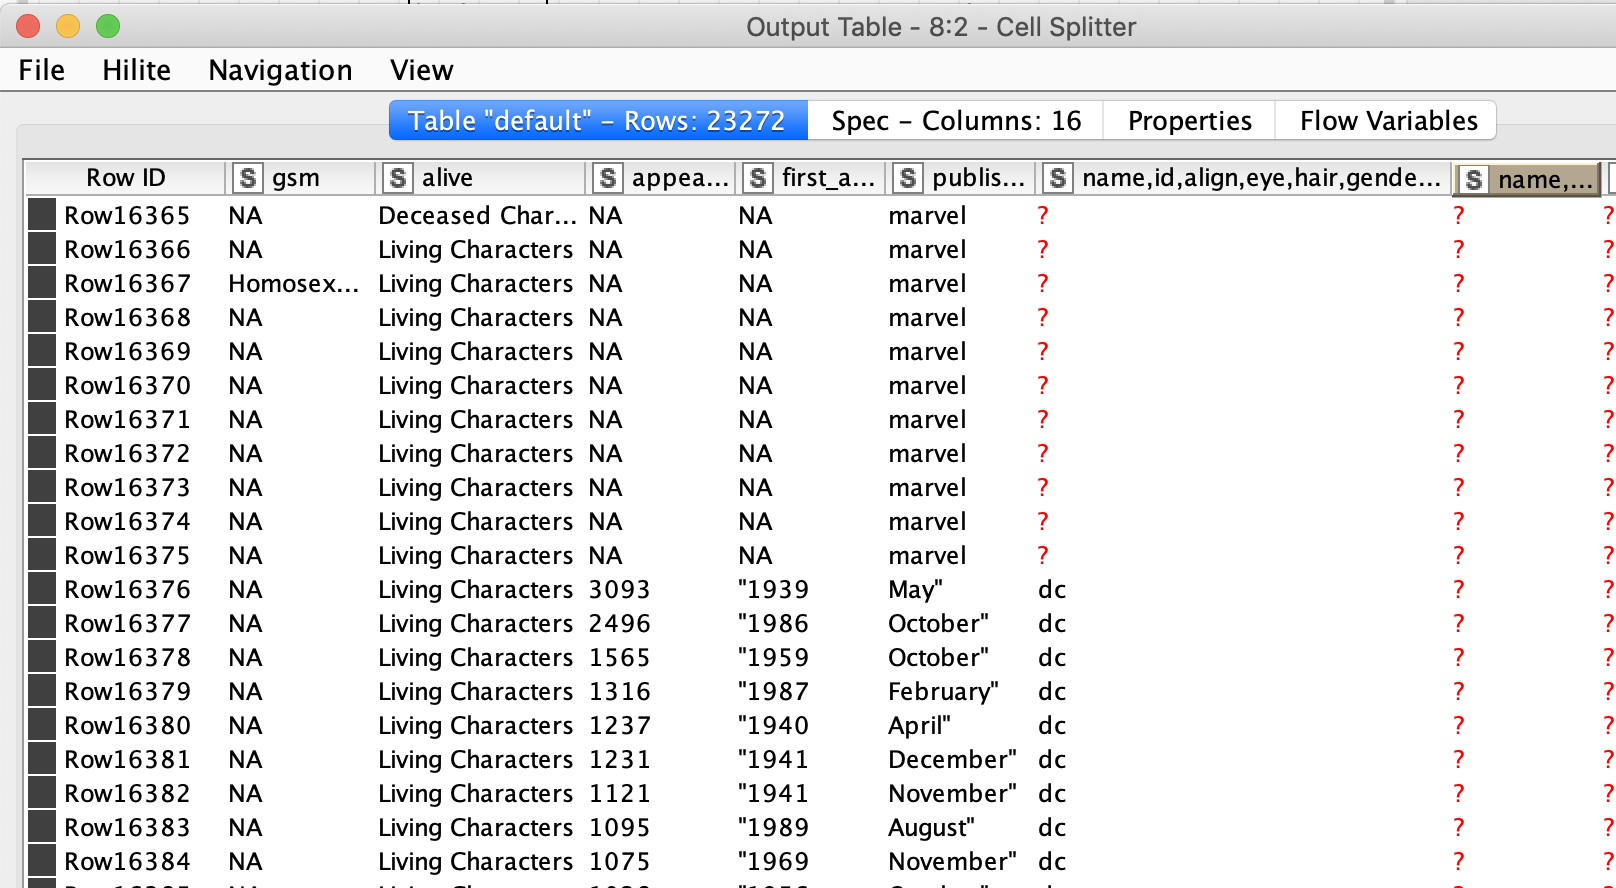
I imported a csv file and all the columns look fine in the file reader (have to use allow short line for it to be read correctly). However, when I create a bar chart or use groupby note, the columns get mixed up. For example, gender column only has male and female and NA values, but for some reason, the bar chart reads data from another column named hair color.
Are you able to share the data and the workflow? If you are we might take a look. These things come to mind:
i would recommend doing a group by on the columns in question to see if they really do not contain the unwanted data (if they do the problem is with the import)
you mentioned you had to use “short line” to import the data. CSV files can be tricky i a separating character also appears in the data itself. KNIME sometimes is seemingly not so great in handling that.
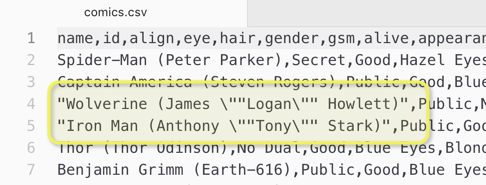
from the screenshot there seem to be quotes and maybe even cascaded quotes in your data, this could easily mess up the columns on import
you could try doing the import with the R package Readr *1) or you could try the File Reader of KNIME instead of the CSV reader *2) - they give you more control about how to import data
if you can get the data via a more stable format then CSV you might want to use that
Thank you very much for your help It is definitely the problem with importing. I looked at it more carefully and it seems that several rows are not imported correctly. I used File reader node but it did not solve the problem. I am new to KNIME. I tried R source node but I am not sure how to make it work. I will continue working on it and post a reply when I solve it.
If you are able to upload the data or a sample that shows the potential problems we would be able to have a look. I would recommend trying to use the R package or get the data in a more ‘stable’ format. Like using a more exotic separator like “|” or even “¤” (Ascii 207) - we used to call this the “run over turtle” and it is very uncommon though still an ascii sign.
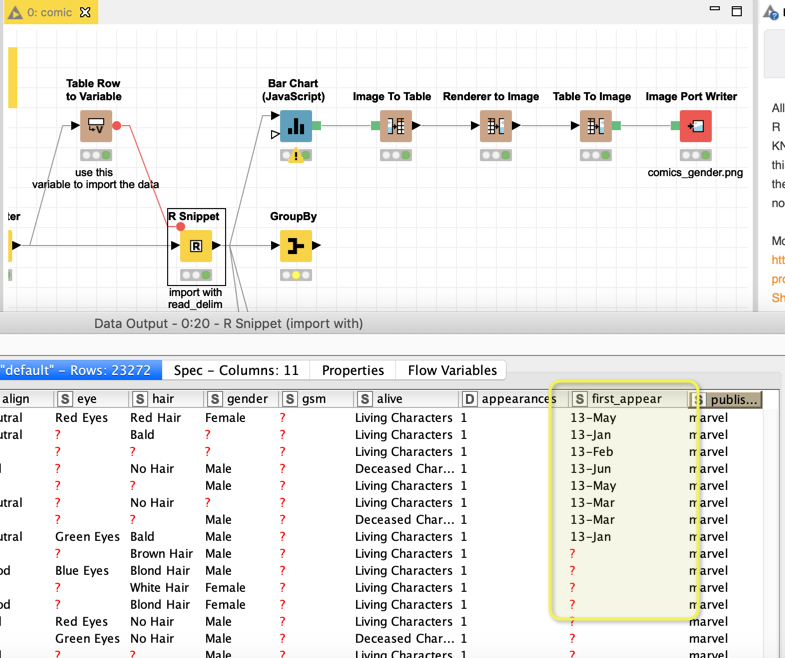
with the help of R’s Readr I was able to load the data and now it seems there is no mixup in the data. Although some columns need serious work if you want to use them like first_appear which is a strange mixture of dates and some missing.
You should analyse the data with group bys and check some plausibility because also with Readr there is no guarantee it caught all the quirks. It looks like a mixture of several data bases with slightly different structures. You might want to check them.
You could use the Line Reader node to just read the file line by line. Connect it to the Cell Splitter node to split the file using specified delimiter. Both nodes allow to keep the Column headers, so you won’t lose this information. Then you could filter unwanted Rows and Columns, e.g. those with missing values, using the respective filter nodes.
<smartypants mode>
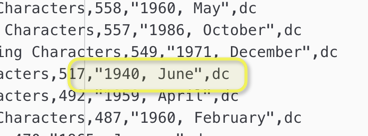
The problem is you would loose the information when you might just as well have kept it. And in this specific dataset with just the split by “,” you will get a systematic shift further down the line because of the strange
, “1940, June”, dc
construct.
</smartypants mode>