Hi @danshu09 ,
The comparison of two files based a unique key can be done using the Joiner node. Specify the key as the joining column in each, and also have it bring back matches, as well as unmatched rows. You can then compare the non-key columns on each joined row.
The second part, providing some kind of conditional formatting can be done, but to do so you will need to have an extension installed. The “Continental nodes” allow you to specify some formatting with KNIME which is then applied to an unformatted spreadsheet to which data has been written,
and the result written to a new formatted xlsx file. An alternative is the use of the Write to Excel template node where you can define the formatting within an xlsx file, and then write your data to it.
I’ll give an example here using the Continental XLS Formatting nodes.
https://www.knime.com/community/continental-nodes-for-knime-xls-formatter
There is a learning curve to using them, and you may wish to do some reading of the above links.
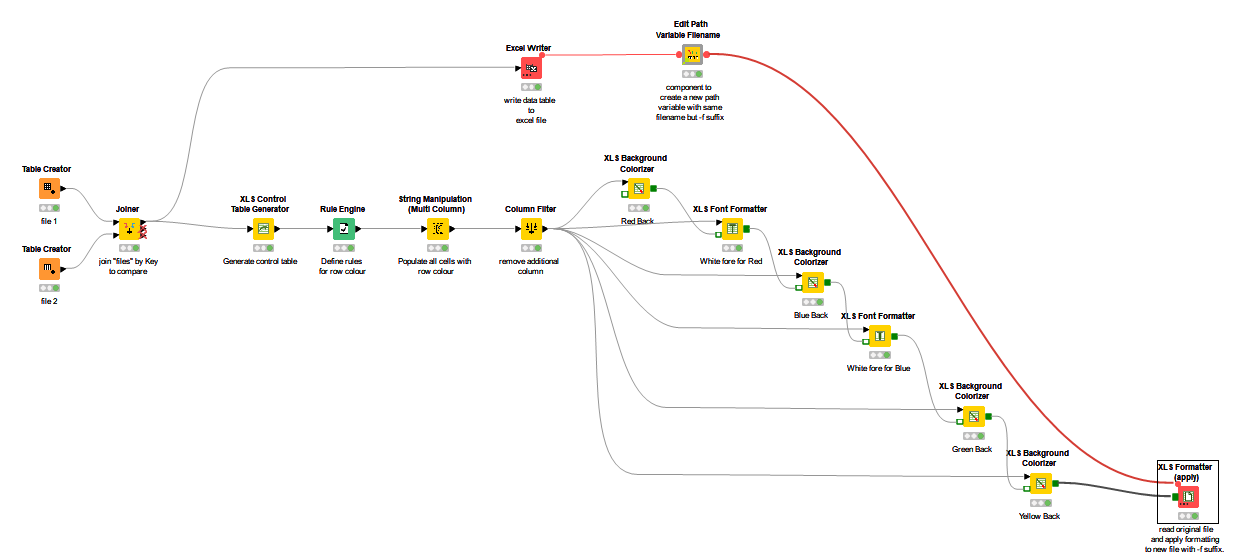
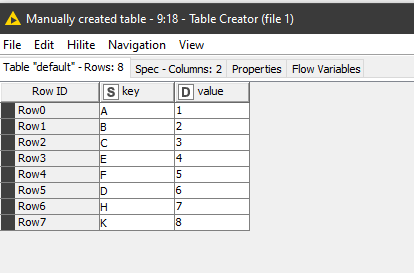
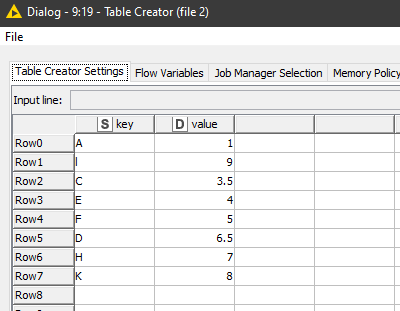
In this example, there are two files (simulated with Table Creators) on the left.
These are joined, and then a “control table” (used by the XLS Formatter nodes) is created. I’ve then applied a Rule Engine to that control table, to replace the cells in the Control Table with labels for the colours yellow, red, blue or green depending on the state of each record.
The Control Table acts as a positional storage of “tags”, where each cell in the control table represents a cell in the original table, and the “tags” (in this case I chose colour names) are then used by subsequent XLS formatter nodes to change cell attributes (e.g. colour) for all cells containing the name tags. So for example, in the case of the “Red” tag, there is an XLS Background Colorizer which sets the background to Red for all cells where the “Red” tag is specified, and an XLS Font Formatter which sets the foreground to White where the “Red” tag is specified.
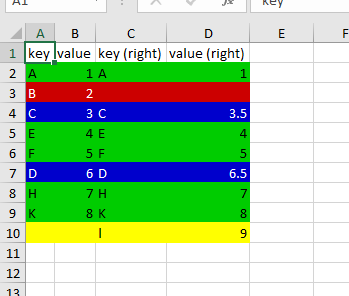
Green = same
Blue = Different
Red = Deleted record
Yellow = Inserted record
I’ve arbitrarily used colour names as the names of the “tags” for each cell. The various XLS Nodes e.g. XLS Background Colorizer then apply colours to the cells based on the tag.
I’ve also made use of another component “Edit Path Variable Filename”:
which is for convenience and allows me to create a path variable “on the fly” from another path variable, but with minor changes to the path such as in this case adding the suffix “-f” to the file generated by Excel Writer, and then this new filepath is used to create the actual (formatted) output file using this newly modified path.
Generated output:
Colour Spreadsheet.knwf (95.4 KB)