Hello
So i am extremely new to programs such as Knime and am stuck on an issue for my assignment.
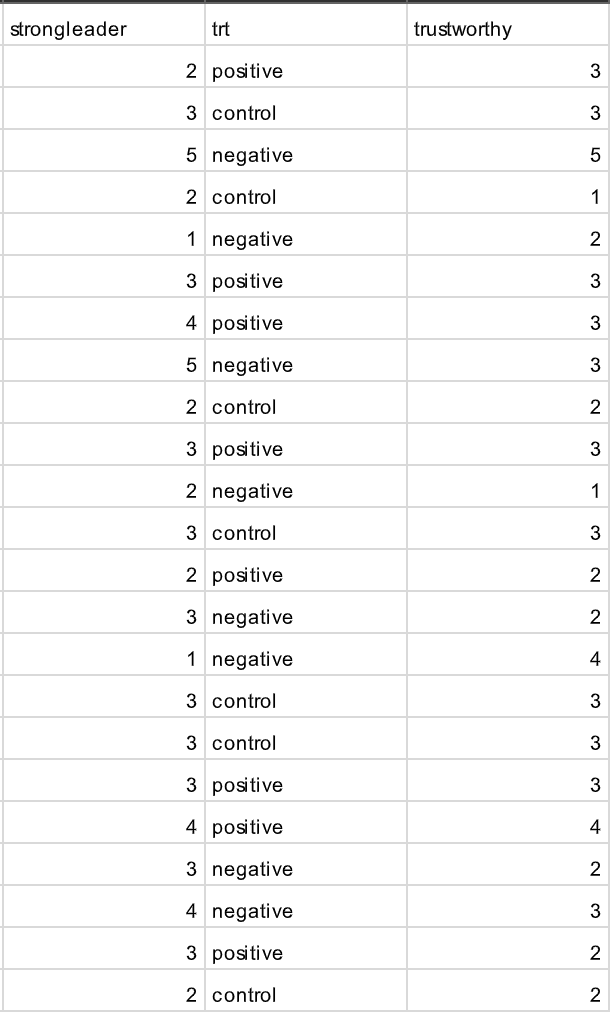
so my assignment is about how the tone in twitter comment sections affect how people view political candidates.
We have 3 types of groups positive, negative and control, where positive were respondents presented with positive comments, negative is the opposite and control group had no comments.
I want to compare the variables so that i f.ex. can see the mean of how trustworthy a group perceived the candidate to be.
okay so it worked! do you know if its possible to create a box-plot based on this? I tried adding the node but it it just put them in as two different variables on the graph.