Hi everyone,
I’m currently working on a comparison for online marketing performance. Every quarter of the year I want to add the performance data of the last quarter. I have an excel file with the data of quarter 1 (Tab Q1) and then I have another excel file with the data of quarter 2 (Tab Q2).
Test-KNIME.xlsx (13.4 KB)
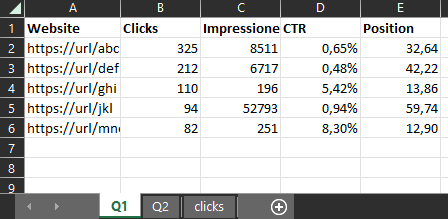

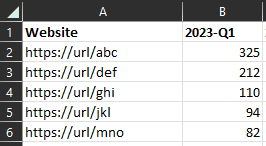
I already worked out a KNIME workflow that separates clicks, impressions, CTR and position of Q1 in single files:

The outcome of it is this:
But now I’m a bit stucked. Do you have an idea how I can add the data of Q2 next to it? It should look like the sheet “clicks” in my example file:
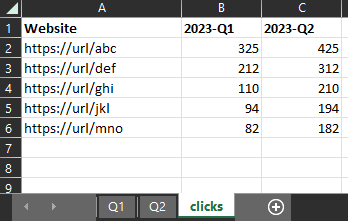
It would be great, if I could have an excel file with different sheets in the same file for clicks, impressions, CTR and position.
Thank you very much in advance.
Cheers,
Alex