I make experience of some issuses with the node “Continuous error plot (Plotly)”.
First of all it doesn’t seem to work with CSS editor.
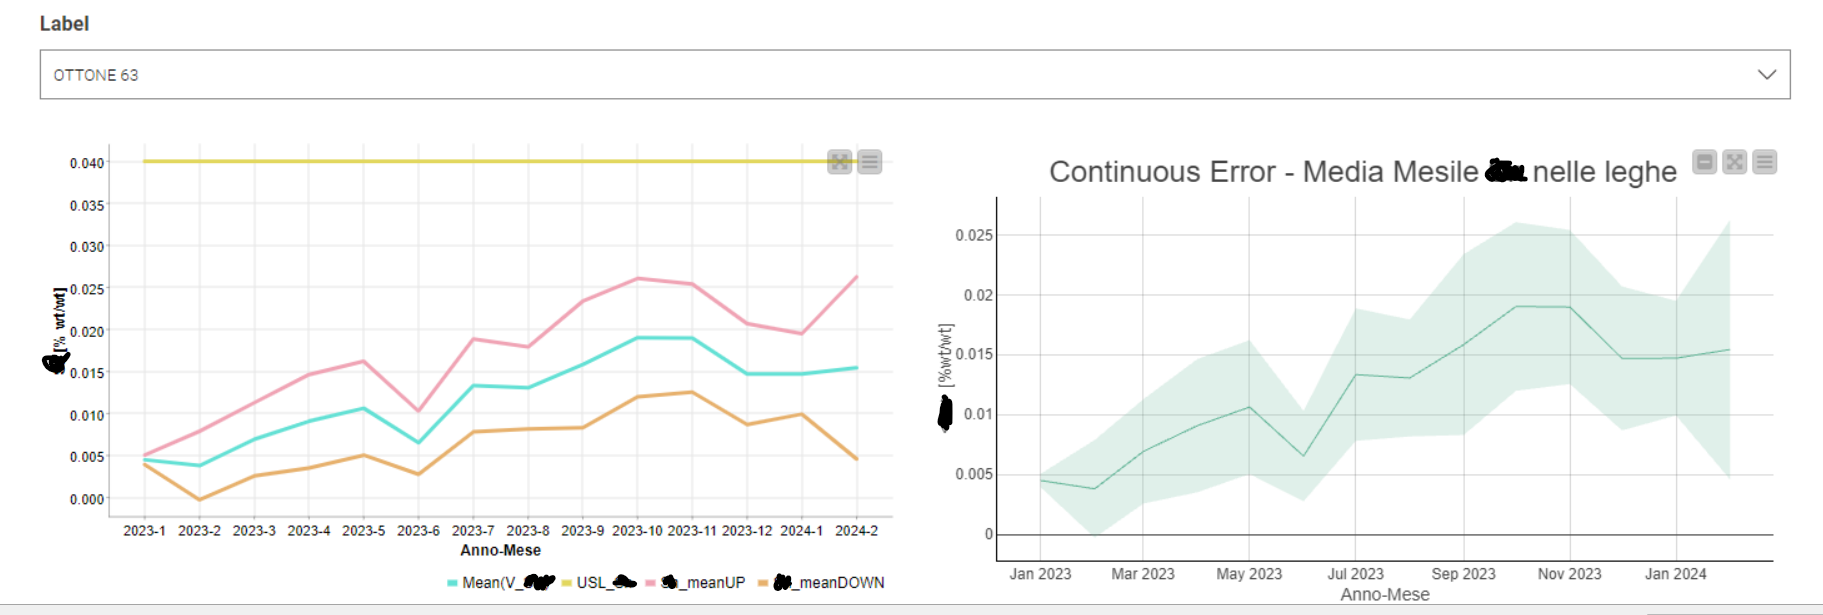
Second I build up the following workflow where through the “Value Selection Widget” I refresh an analysis and the relative plots according to the alloy type selection
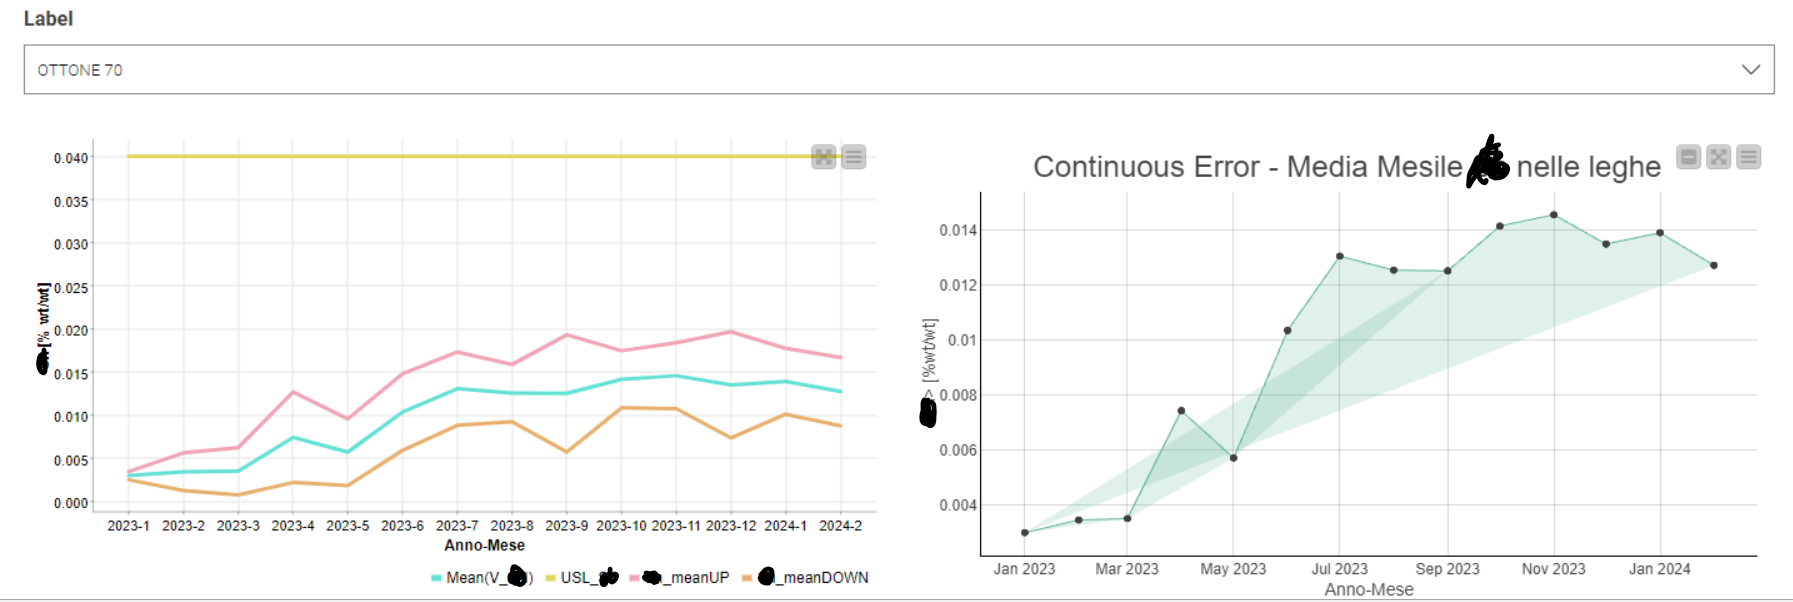
the two plot generated by the component are substantially the same, the first is the output of the Line Plot the second one is the output of Continuous error Plot (Plotly). The problem is that when I select a new alloy (see below: “ottone 70”) the Line Plot is correctly updated but the Continuous error Plot (Plotly) it is not! To update this last plot I have to open the component and reset the node “Continuous Error Plot”. Why does it happen?
To better understand the problem and provide assistance, would you mind sharing a workflow along with some dummy data? This would allow me to replicate the issue on my end and try resolving it.
please find attached a similar workflow with dummy data which have the same issues above described. I omitted the CSS editor piece which in any case doesn’t work with both graphic nodes present in the testing workflow.
One workaround for the issue would be using a Generic ECharts View node. I have attached a workflow on how to implement this. You can make further changes as per your requirements. I hope this helps.
Is it possible that Generic ECharts View node is available only for 5.2 version of KNIME?
I don’t find this node in the KNIME View (Labs) extension installed in 4.7.8.