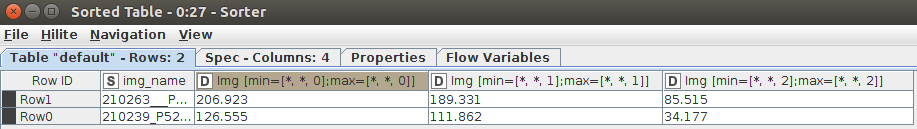
Now I want to classify values under 3 or 4 different colornames, like, yellow, blue, grey or red (above table is falling into yellow for example), into an additional column. Is it possible? (I am afraid I do not know javascript).
Thanks!
my naive approach would be to create new columns with the rgb values of your colors (yellow, blue,…). Then you compute the differences between your image’s colors and these values and decide for the color with the lowest difference.
Example
r206 g189 b85 (in your table)
difference to yellow (r255 g255 b0): r49 + g66 + b85 = 200
difference to blue (r0 g0 b255): r206 + b189 + b170 = 565
difference to grey (r128 g128 b128): r78 + g61 + b43 = 182
But as you see this does not work very well. Your yellow would be categorized as “Gray”. RGB does not really work that well for that. I found somebody on stackoverflow suggesting to convert to HSV for that purpose. You could use a ColorSpace converter for that.
Cheers,
Johannes
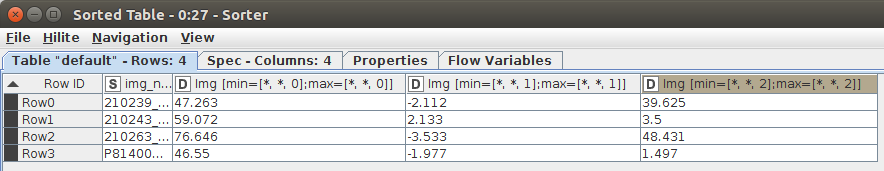
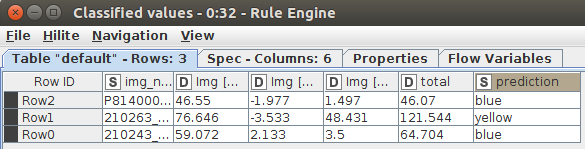
This seems a good separation, since row0 and row2 is yellow images, and row1 and row3 is bluish images. For the moment, I want to go for these two colors only. Final aim is writing “image_filename,yellow” lines to a csv file. What can be the next step? I could not find a way to apply;