I am currently facing a problem I am trying to solve and/or analyze. I have several thousand events in a time series, which means I have an event (tagged with a label) along with a date/time stamp. I am trying to analyze if there are sequences of events which occur after another.
My first idea was to do a lag on the labels (i.e. lag all rows x times) and then do a one-hot encoding of the labels (each category is either 0 or 1). This means I end up with a table similar to this one:
I then did a Linear Correlation between the categories. However, I think that this actually is wrong, as the Linear Correlation would interpret the one-hot-encoded values as numeric values and do a Pearson’s product-moment coefficient on zero’s and one’s.
Then I had the idea to use the Linear Correlation node without one-hot-encoding the categories (ie categories are strings), so I’d just input a table like this:
This will then be nominal values, hence Pearson’s chi square test will be used by the Linear Correlation node. However, the correlation calculated will only tell me IF there are ANY correlations between the lagged categories, but I cannot find out which rows correlate (ie what values in category(-1) and category(-2) correlate with a certain values in category).
Does anybody have a “best practice” on how to tackle this kind of problem/analysis? Or am I just blind to see the best solution
Hi @giggo_m, apologies for the, very, delayed response. Slipped through the cracks a little bit here.
You may have solved your problem or moved on but I’ll try to offer a little bit on my opinion on the problem, in case any other readers pass by.
Normally when we’re dealing with numeric Time Series data we like to talk about the Autocorrelation of the series, commonly plotting the statistic as we explore the data (ACF plot). We use this information to look for patterns in our series and inform the types of preprocessing and modeling we might do later.
Now that’s pretty straight forward with numeric data, we can just lag the series as you suggest, calculate Pierson’s Correlation between the current value and each lagged copy. Plotting this gives the ACF plot we use so often.
The analog to talking about correlation with numeric data is often to run a Chi-Square test, but this gives a binary result, accept or reject the Null Hypothesis (based on some significance level) as you say. There is a statistic we can calculate on top of the Chi-Square test called Cramer’s V though. This assigns a numeric value (between 0 and 1) indicating the strength of the relationship between the categorical variables.
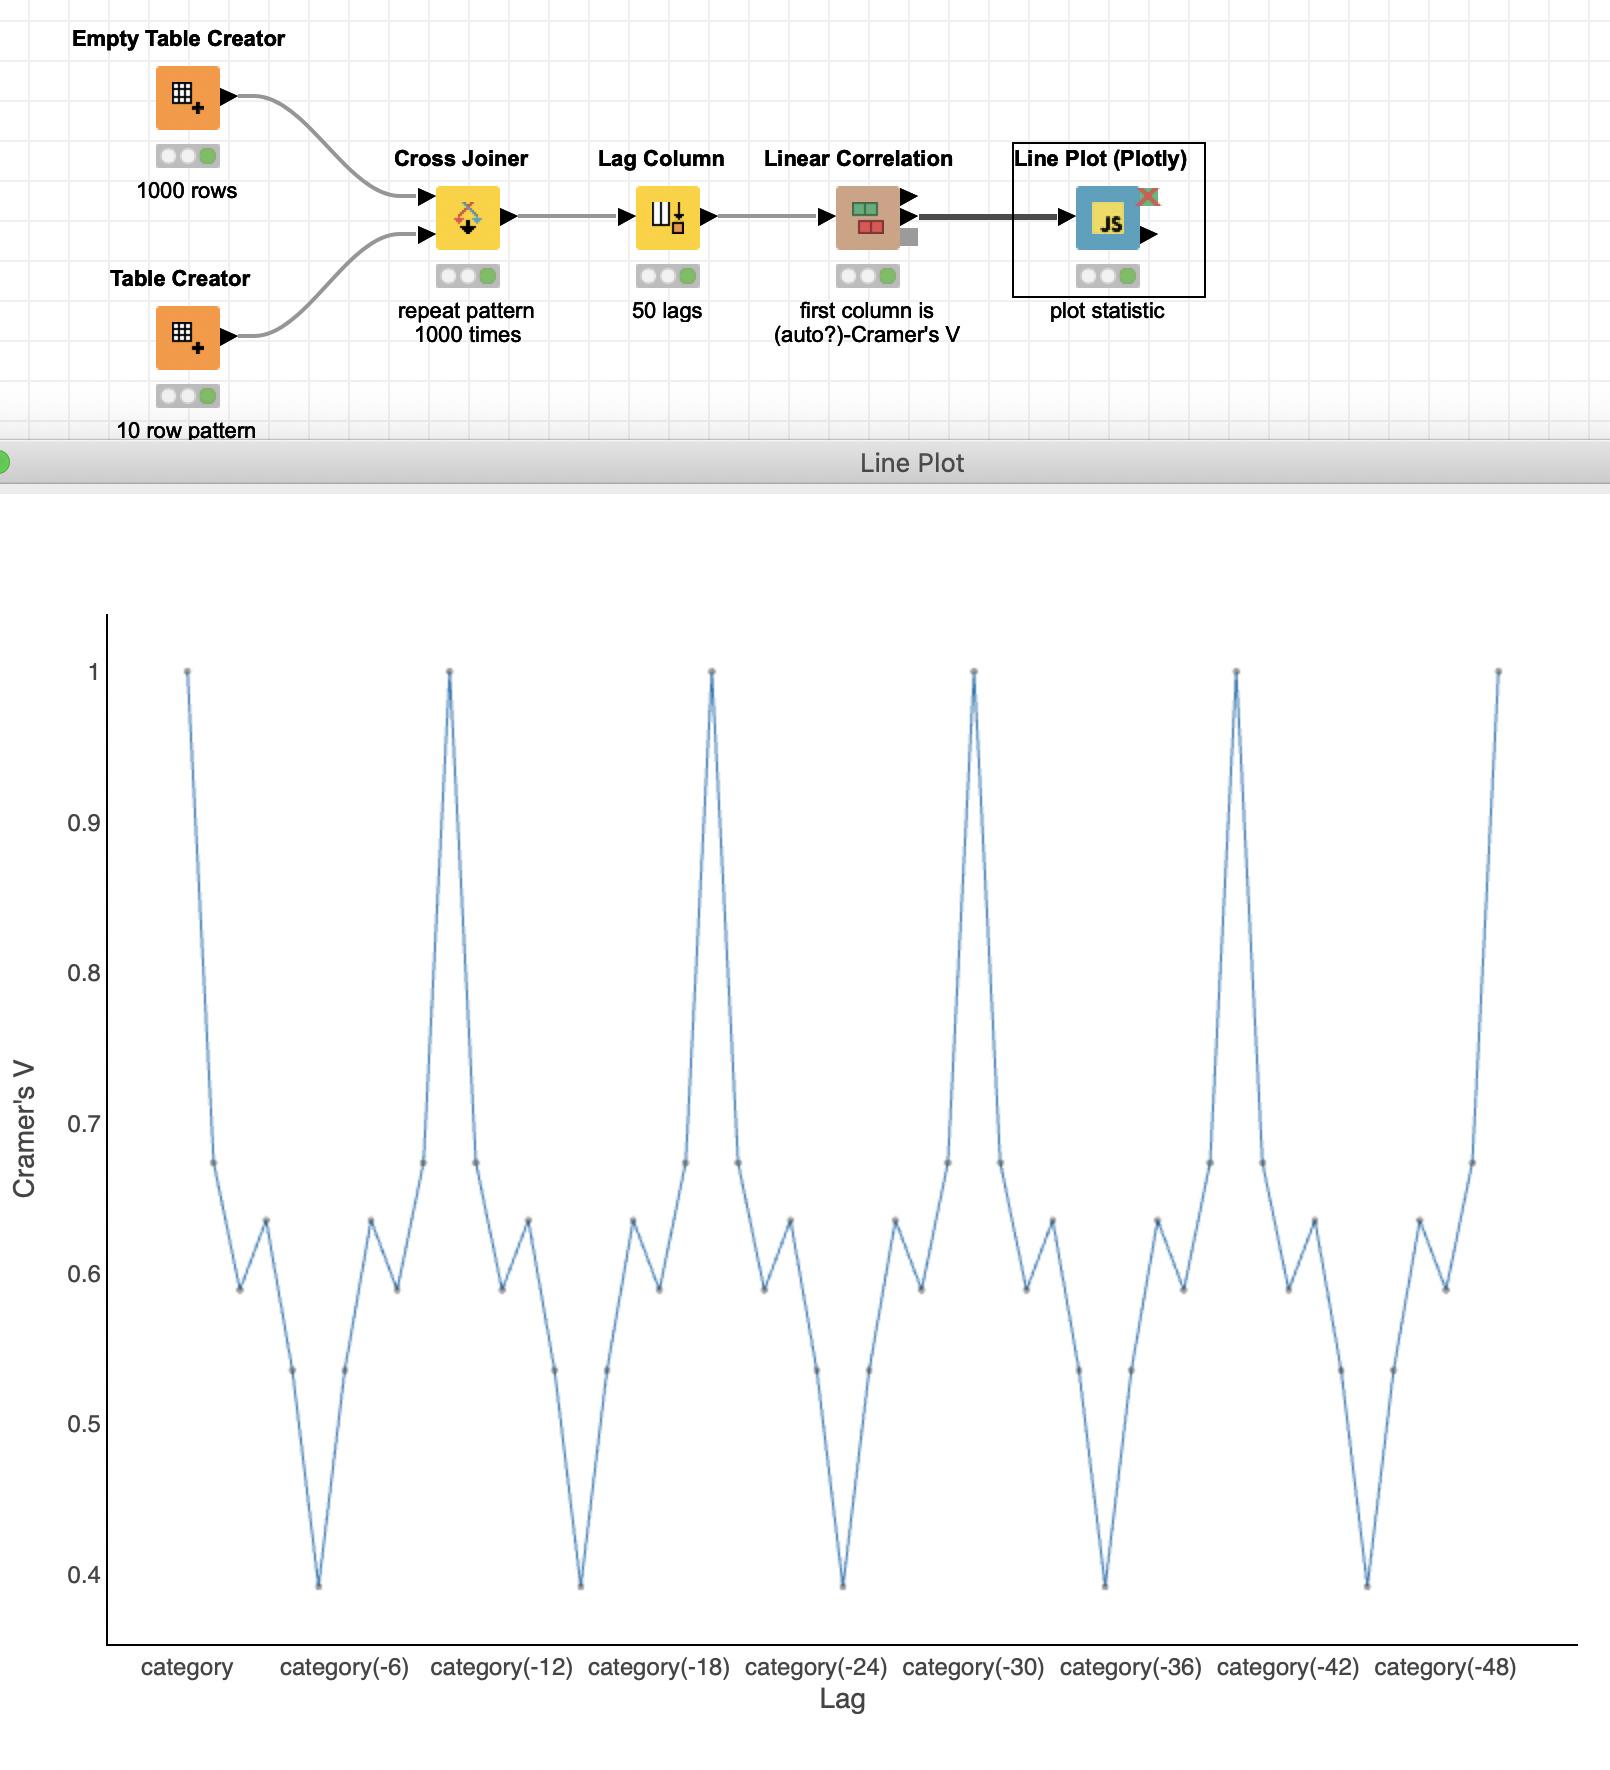
The Linear Correlation node in KNIME outputs this value in the Correlation Matrix output of that node. Plotting the first column of that matrix will give us something akin to that ACF plot with numeric Time Series.
In the screenshot you can see the values of Cramer’s V spikes every 10 lags (the length of the pattern)
Link to example on hub
One last note, by default the Linear Correlation node only considers columns with up to 50 unique values. If you have more unique events than that make sure to raise the number in the configuration dialog.