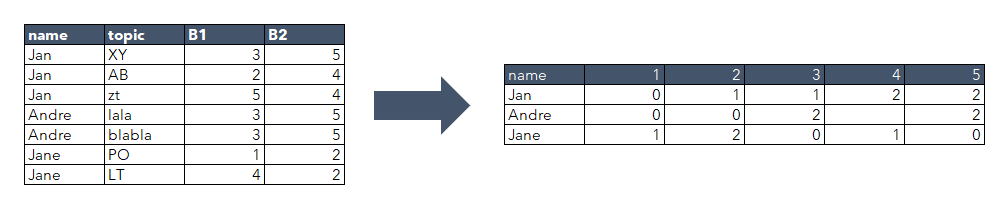
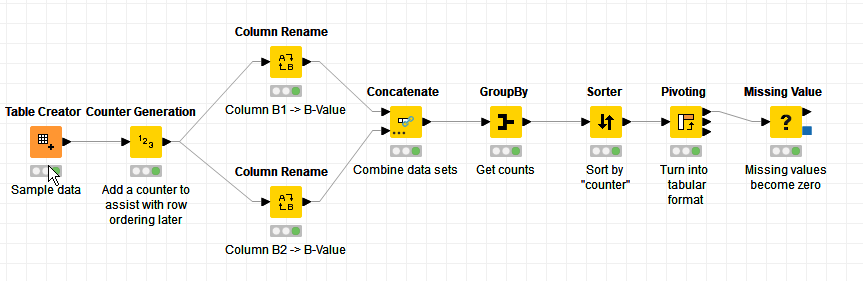
The approach I chose for this was to divide your table into two datasets, and rename columns B1 and B2 respectively to an arbitrary name “B-Value”. These data sets could then be recombined by concatenation and at this point we can use Group By to count the occurrences of “B-Value” for each name.
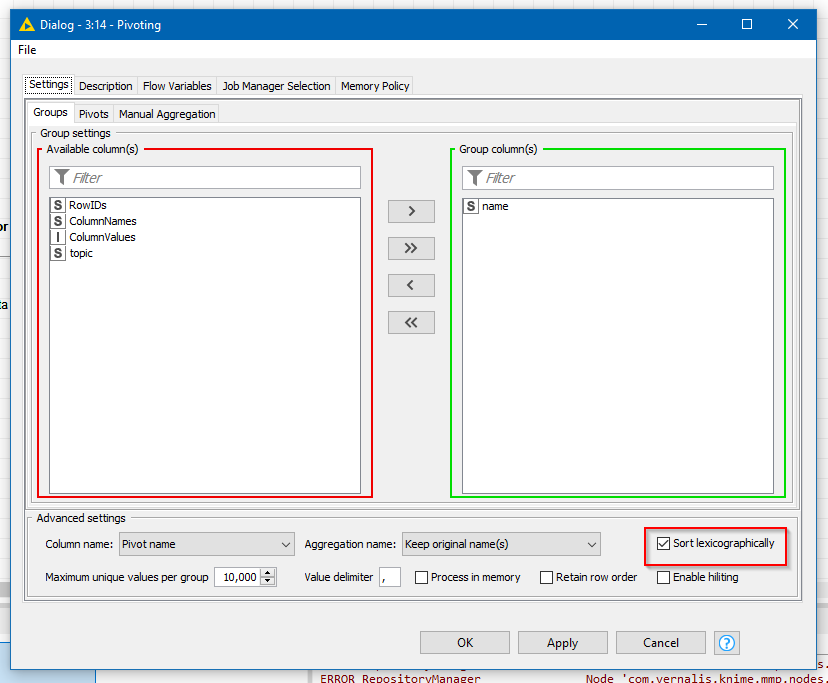
The key to transforming data to “tabulated” format as you required in your output is the “Pivoting” node, and the data can then be tidied up so that any “missing” counts are set to zero.
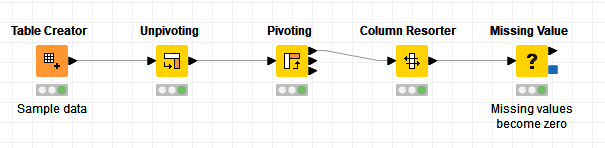
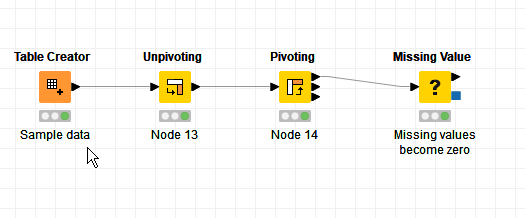
There is an other way to solve this problem. And that is by using the Unpivot node. See Counting References Unpivoting.knwf (29.4 KB)
Happy KNIMEing
gr. Hans
Hey @navo , I’ve not run @takbb 's workflow, but it’s exactly how I would have done it on my side - “merge” the 2 B columns since we don’t care if the values are from B1 or B2, do a GroupBy to get the counts, and pivot to move from vertical to horizontal.
I’m not sure what’s missing there. This should give the answer you were looking for. Can you elaborate what was missing and how you fixed it?
The workflow of @takbb gave me at the end always only “1” as counted, so I changed a little bit and came to my desired result (without topic). However, I have now also tested the workflow of @hanss and that works as well.
I share the workflow where I tested both and came to the same result.
Yes @Bruno29a, you are quite right that it was my GroupBy. I hadn’t spotted that by introducing the counter to enable sorting into original order, it mucked up the Group By. Not sure how I didn’t spot that. It was all going so well up to that point!
Anyway, for completeness I haver attached workflow with correction to the group by. I had forgotten to include min(counter) in the group by so every counter was causing a group of exactly one! With that in place, it worked as intended with the row ordering.