I have a dataframe in knime with two columns.
Column1, which is a Number(Integer)
Column2, which is a Number(Double).
This is a very simple dataframe:
Column1 | Column2
1 | 255
2 | 234
3 | 234
4 | 435
5 | 345
6 | 456
7 | 567
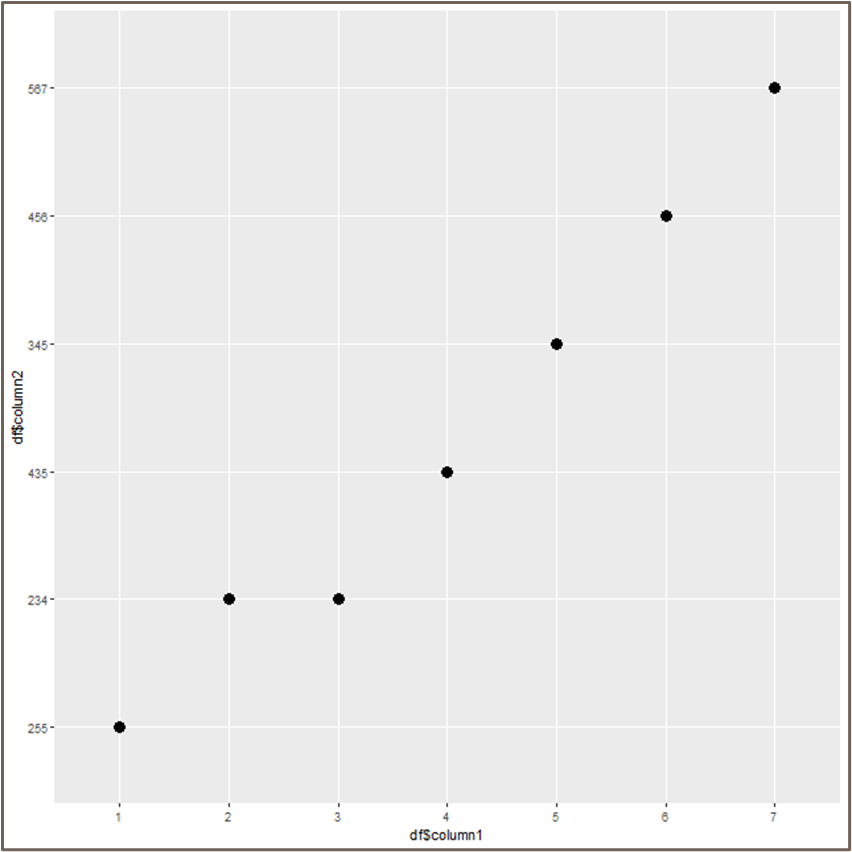
What I want is a scatterplot, with the Column1 in the X axis and the column2 in the Y axis, so we can see the progression of the values in Column2 across Column1.
I’ve tried with an R view with the following code:
library(ggplot2)


# Create the scatterplot using ggplot2
ggplot(knime.in, aes(x='Column1', y= 'Column2')) +
  geom_point()
This provides a scatterplot with just one value on the X axis. so I decided to convert it to numeric just in case.
library(ggplot2)

knime.in$"Column1" <- as.numeric(knime.in$"Column1")
knime.in$"Column2" <- as.numeric(knime.in$Column2")

# Convert the input data to a data frame
knime.in <- as.data.frame(knime.in)

# Create the scatterplot using ggplot2
ggplot(knime.in, aes(x='Column1', y= 'Column2)) +
  geom_point()
But I still get a plot with just one value on the X axis. Not sure what is wrong