I developed a workflow for a binary classification model, and I would like to create a table that provides confusion matrix calculations at different threshold values:
Table 1 sorts the predicted probabilities in descending order and shows the ground truth next to the probability (this part is easy). something like this:
Row
Truth
Probability
1
1
0.995
2
1
0.991
3
1
0.875
4
0
0.811
5
1
0.73
6
1
0.71
7
0
0.649
8
1
0.602
9
0
0.577
10
0
0.522
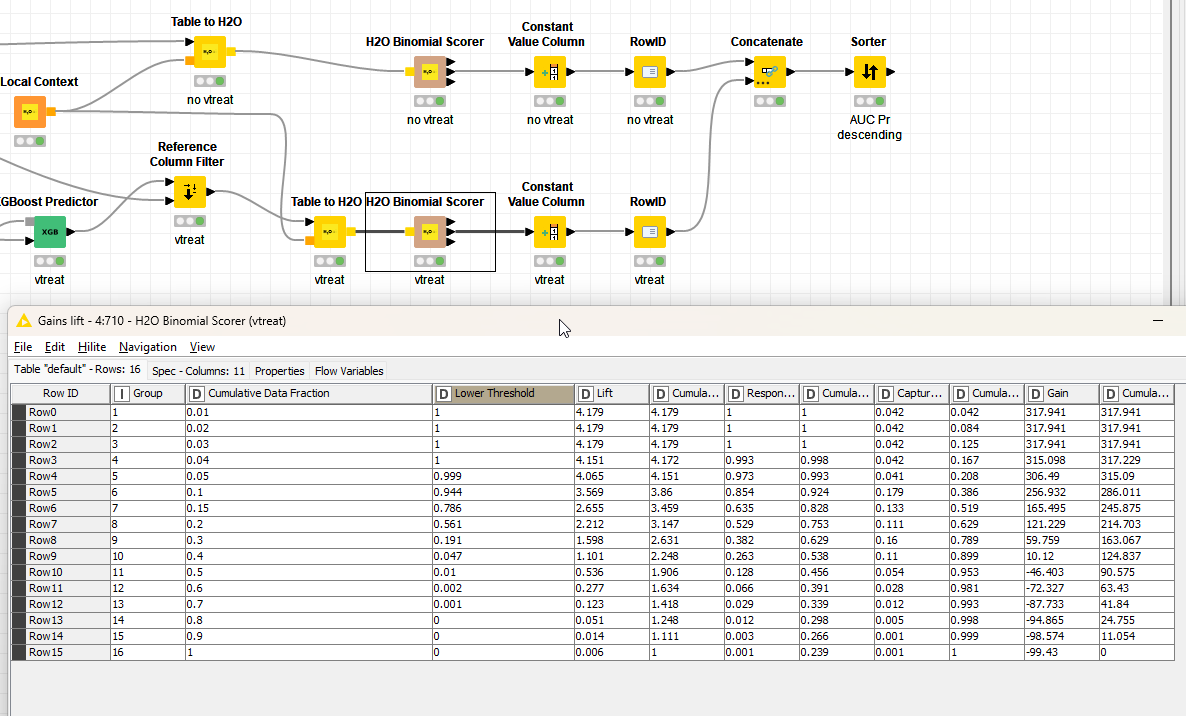
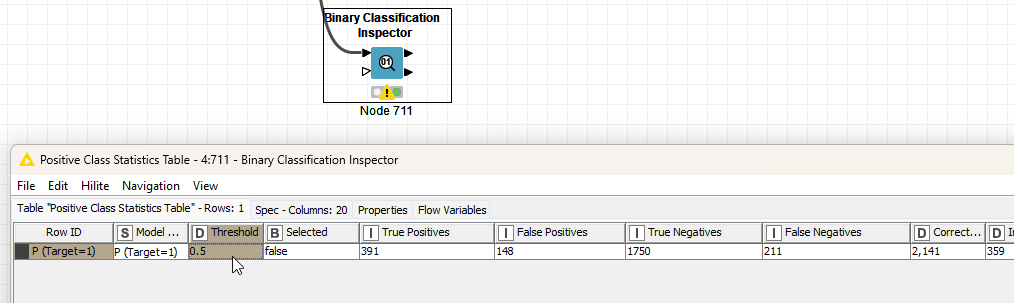
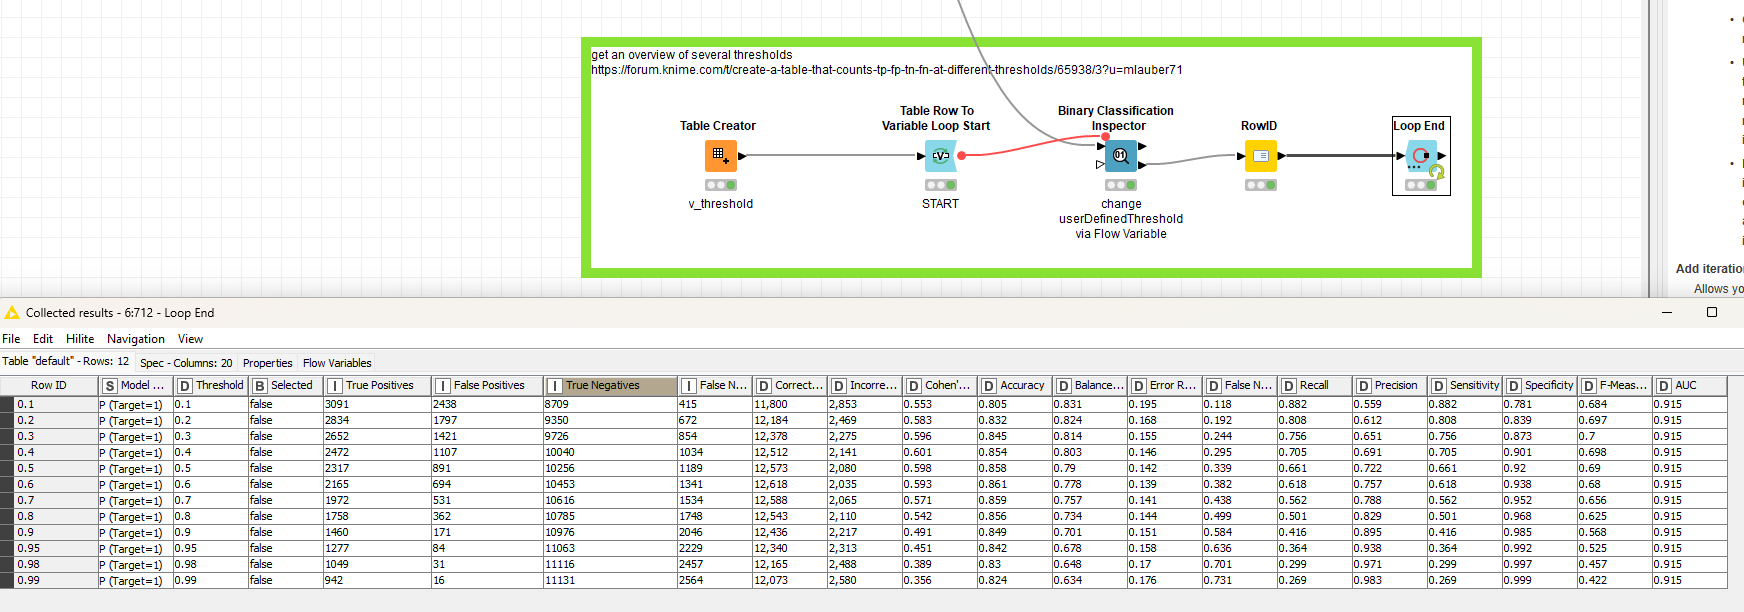
Based on Table 1, Table 2 then counts the number of TP, FP, TN, FN at different threshold values ranging from 1 to 0:
Hi,
You can for example use a Counting Loop Start to loop 10 times over your table. Inside the loop, you can calculate the cutoff using the Math Formula (Variable) node (e.g. just divide the currentIteration flow variable value by 10) and then you can calculate your metrics using Rule Engine and GroupBy. Then end the loop with a normal Loop End. Hope this helps!
Alexander
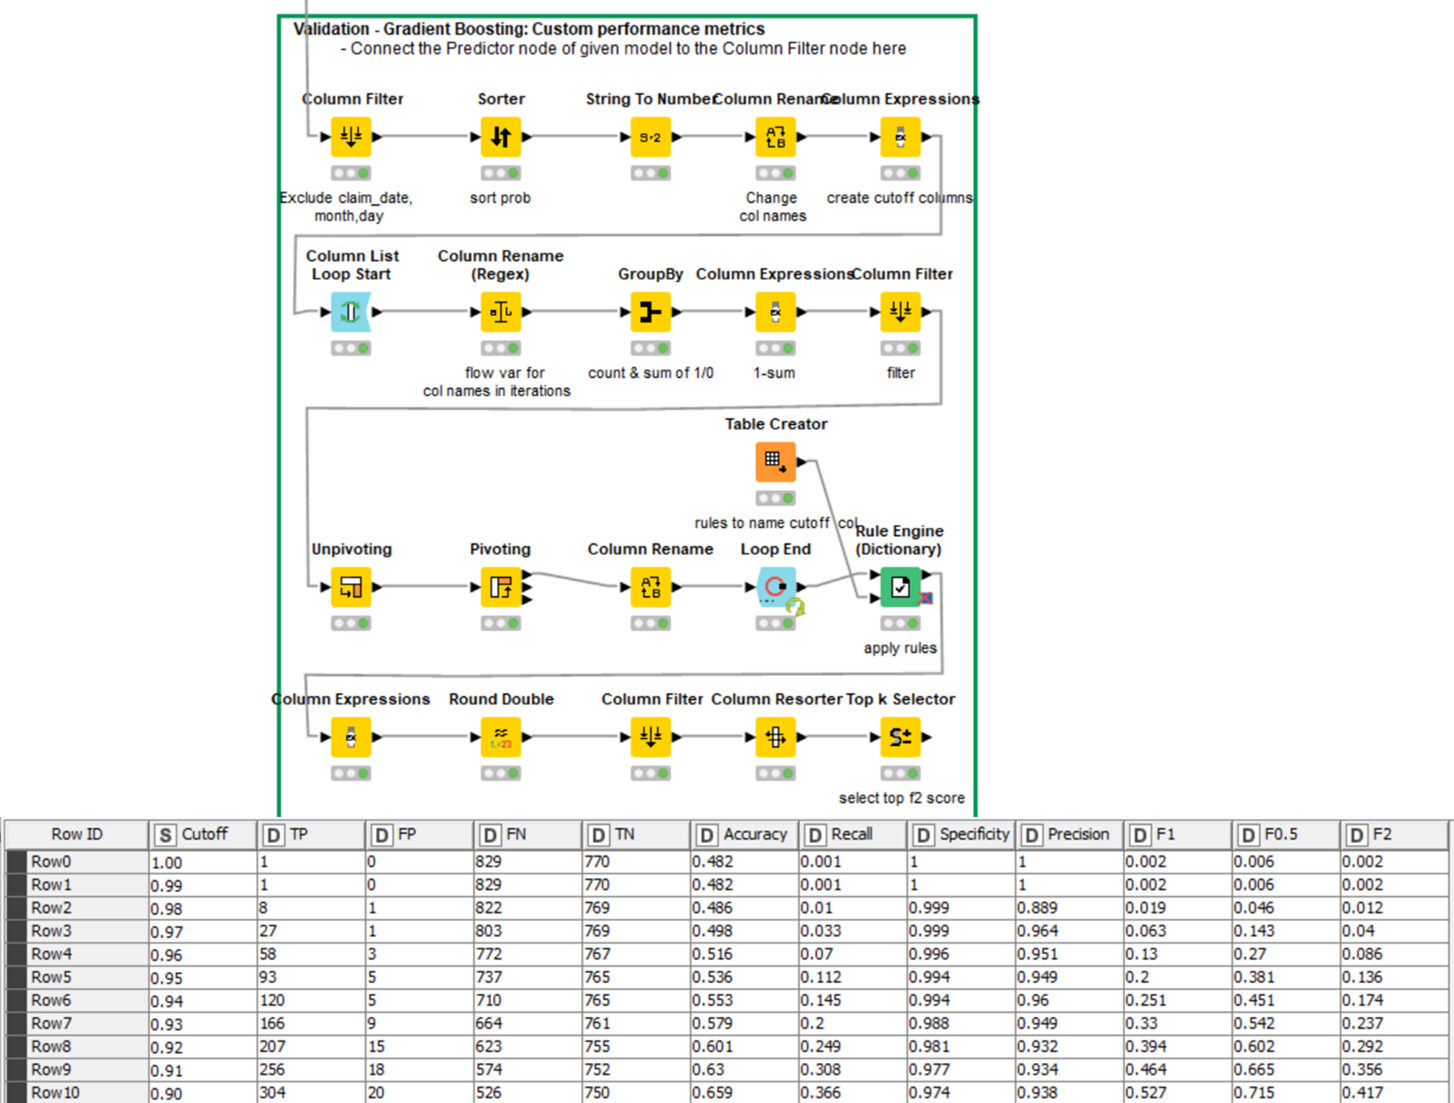
Thank you all! @mlauber71 : I like these solutions. I also managed to develop a custom solution for this. It’s a longer workflow and not as elegant but gives a lot of flexibility.