I’m pretty new to KNIME and I have watched the churn video tutorial with decision trees but unfortunately it didn’t include any guidance on pre-prepping the data before modelling. So, I have a couple of questions regarding how to create a transaction aggression table in KNIME.
I have the following data attributes in a csv file on product sold data level:
InvoiceNo - Unique ID for each transaction (non-distinct in my file since many lines belong to the same transaction) StockCode - The product code for the line item in the transaction Description - Description of the product Quantity - Quantity of products sold on this specific line InvoiceDate - Date of the transaction UnitPrice - The price at which the product is sold CustomerID - Customer ID of which the transaction line was sold to (non-distinct in my file since many transaction lines can belong to the same customer but on various InvoiceDates) Country - The country the customer resides in
From this I would like to create an aggregated transaction table with each row in the table unique to one customer the following attributes:
1 Customer ID
2. The total lifetime spend of the customer
3. The average time distance between orders
4. The total amount of orders of the customer
5. Y/N flag indicating if the customer has shopped in the last month (set from a historic date)
6. Y/N flag indicating if the customer has shopped in the six months (set from a historic date)
7. Y/N flag indicating if the customer has shopped in the twelve months (set from a historic date)
8. The most frequent product (Description) purchased by the customer
10. The average amount of items included a transaction(s) by the customer
9. The country of the customer
Following data import, which tasks, functions and formulas in KNIME can I use in order to get the required aggregated output table?
The key node is the GroupBy node, it does nearly all of the operations that you require, of course some more preprocessing is necessary, especially for the Time/Date differences.
I built an example workflow, which does all the steps that you described. See: data_preparation.knwf (103.7 KB)
Thank you so much for helping set this up, you literally saved my day!
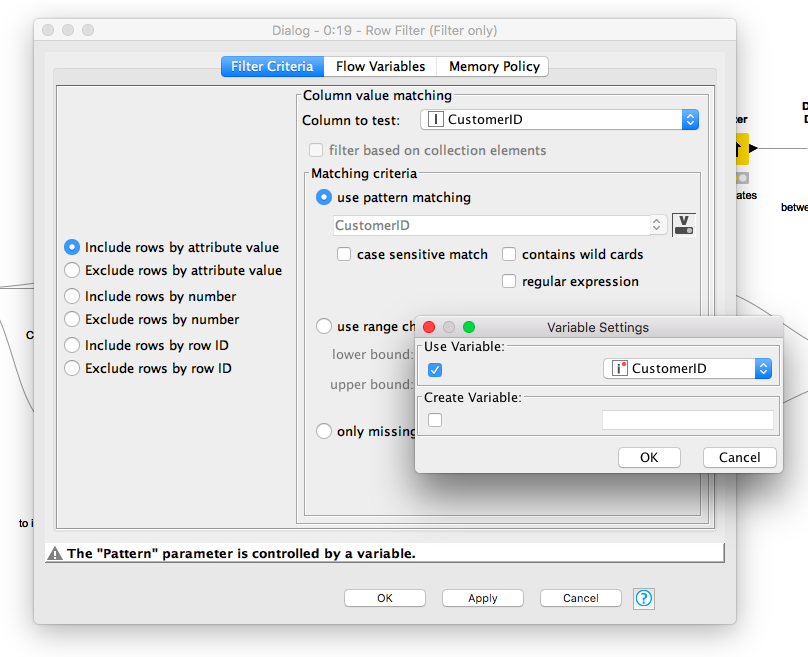
I have started running through the workflow you sent over and everything works fine up until the Row Filter on the upper branch after the loop start where I’m not given the option to execute the node with the following settings:
When I click OK in the node configuration it just says “The settings were not changed. The node will not be reset”. When I leave the node window the Execute option is greyed out.
Perhaps it would be easier if I share the workflow file but I can’t seem to find the .knwf file my workspace area anywhere. Where should this one be located?
You can export workflows by right-clicking them in the KNIME Explorer view on the left and choosing Export KNIME Workflow…, from there you can chose where you want to save the workflow as a .knwf file.
The message you get when clicking OK suggests that the node is already executed, that might also be why the Execute option is greyed out. Could that be the case?
Great, thanks. Attached is the workflow at the state of the error we were discussing (hopefully with input data included). data_preparation2.knar.knwf (59.6 KB)
The message you get when clicking OK suggests that the node is already executed, that might also be why the Execute option is greyed out. Could that be the case?
Yes, I believe this is the case since I tried executing that resulted in errors before.
The data is not included sadly, you have to uncheck the Reset Workflow(s) before export checkbox, otherwise the Excel Reader (XLS) will be reset before exporting.
Edit: But I guess you used the dataset from the UCI? Let me try…
Edit2: So the problem seems to be that the dataset contains missing values, that’s why the row filter creates and empty table and the rest of the loop fails.
A lot of the of the CustomerIDs are missing and represented as missing values, you could solve this by either removing the rows containing missing values using the Missing Value node after the Excel Reader(XLS) or employing some other strategy that might fit.
Thanks again for taking the time to look at this, @oole.
Edit: But I guess you used the dataset from the UCI? Let me try…
Yes, correct.
I have tried to use the Missing Value node to filter out the rows with missing CustomerID but the RowFilter connected still returns no rows after I connect it to the Missing Value from the Excel Reader(XLS). I have exported the workflow (without data but configured as I tried to run it), when you have a chance, you could you please have a look? data_preparation3.knar.knwf (84.6 KB)
That’s because you need to use the table with the filtered-out missing values in all places, not only for the row filter. As so: data_preparation_missing_values.knwf (80.2 KB)
Well in the workflow I provided I assumed every row to be a single order. If one transaction is described by the invoiceNo, you have to do a GroupBy on the InvoiceNo and the customerID before sorting the Dates and calculating the time differences in the loop on top of the workflow.
Also if the average number of items should be a result of the grouped transactions like above you would need to do the same GroupBy before caluclating the average number of items! (middle part of the workflow).
Thanks for noticing this @oole . I have fixed this for the average number of items and this works well.
On the average time between orders branch I have an problem with the output of the GroupBy you suggested. Here is what I’ve done:
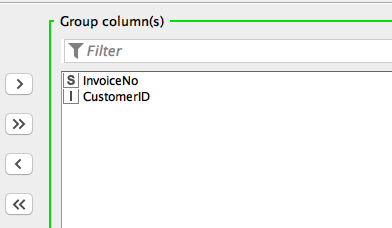
Configured a GroupBy node to group on both InvoiceNo and CustomerID
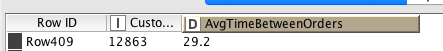
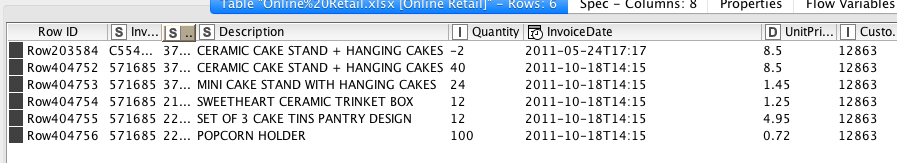
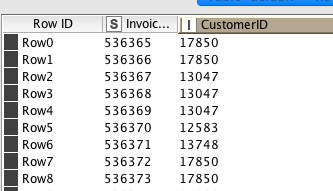
This gives me the desired output where one customer can have one or many invoices (whole order with multiple items attached to the order):
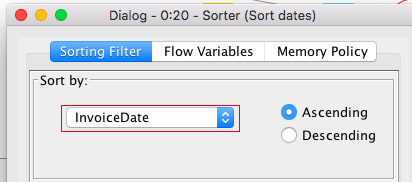
The problem I having is that then the GroupBy node is connected to Row Filter, which is executed, the Sorter Node doesn’t have any InvoiceDate attribute to work with since this attribute disappeared when doing the GroupBy in point one:
So the question is, how do I pass the InvoiceDate through the GroupBy in point one while still keeping the structure as shown in the image in point 2?