Hi All, I am looking for an example where histograms and boxplos are created for all variables in a dataset. (It doesn’t matter if it makes sense for all variables). I would then like to output these generated graphs in the component view. I would be grateful for any help.
Hi @wkoenig,
before you create a separate workflow for that task, have you had a look at the Data Explorer – KNIME Hub node? This node displays a histogram (and several other measures) for all numeric columns and a frequency bar chart for a nominal columns? Then the output can be easily integrated in a component.
Best regards
Jörg
1 Like
Thank you very much for the tip. It is important for me to get a feel for how to create stacked graphs. This especially concerns boxplots, as I don’t always want to configure them. This is helpful when I want to analyze different datasets (with different column names…) schematically the same way and just want to report graphs for them by default. Many greetings Wolfgang
Hey Wolfgang,
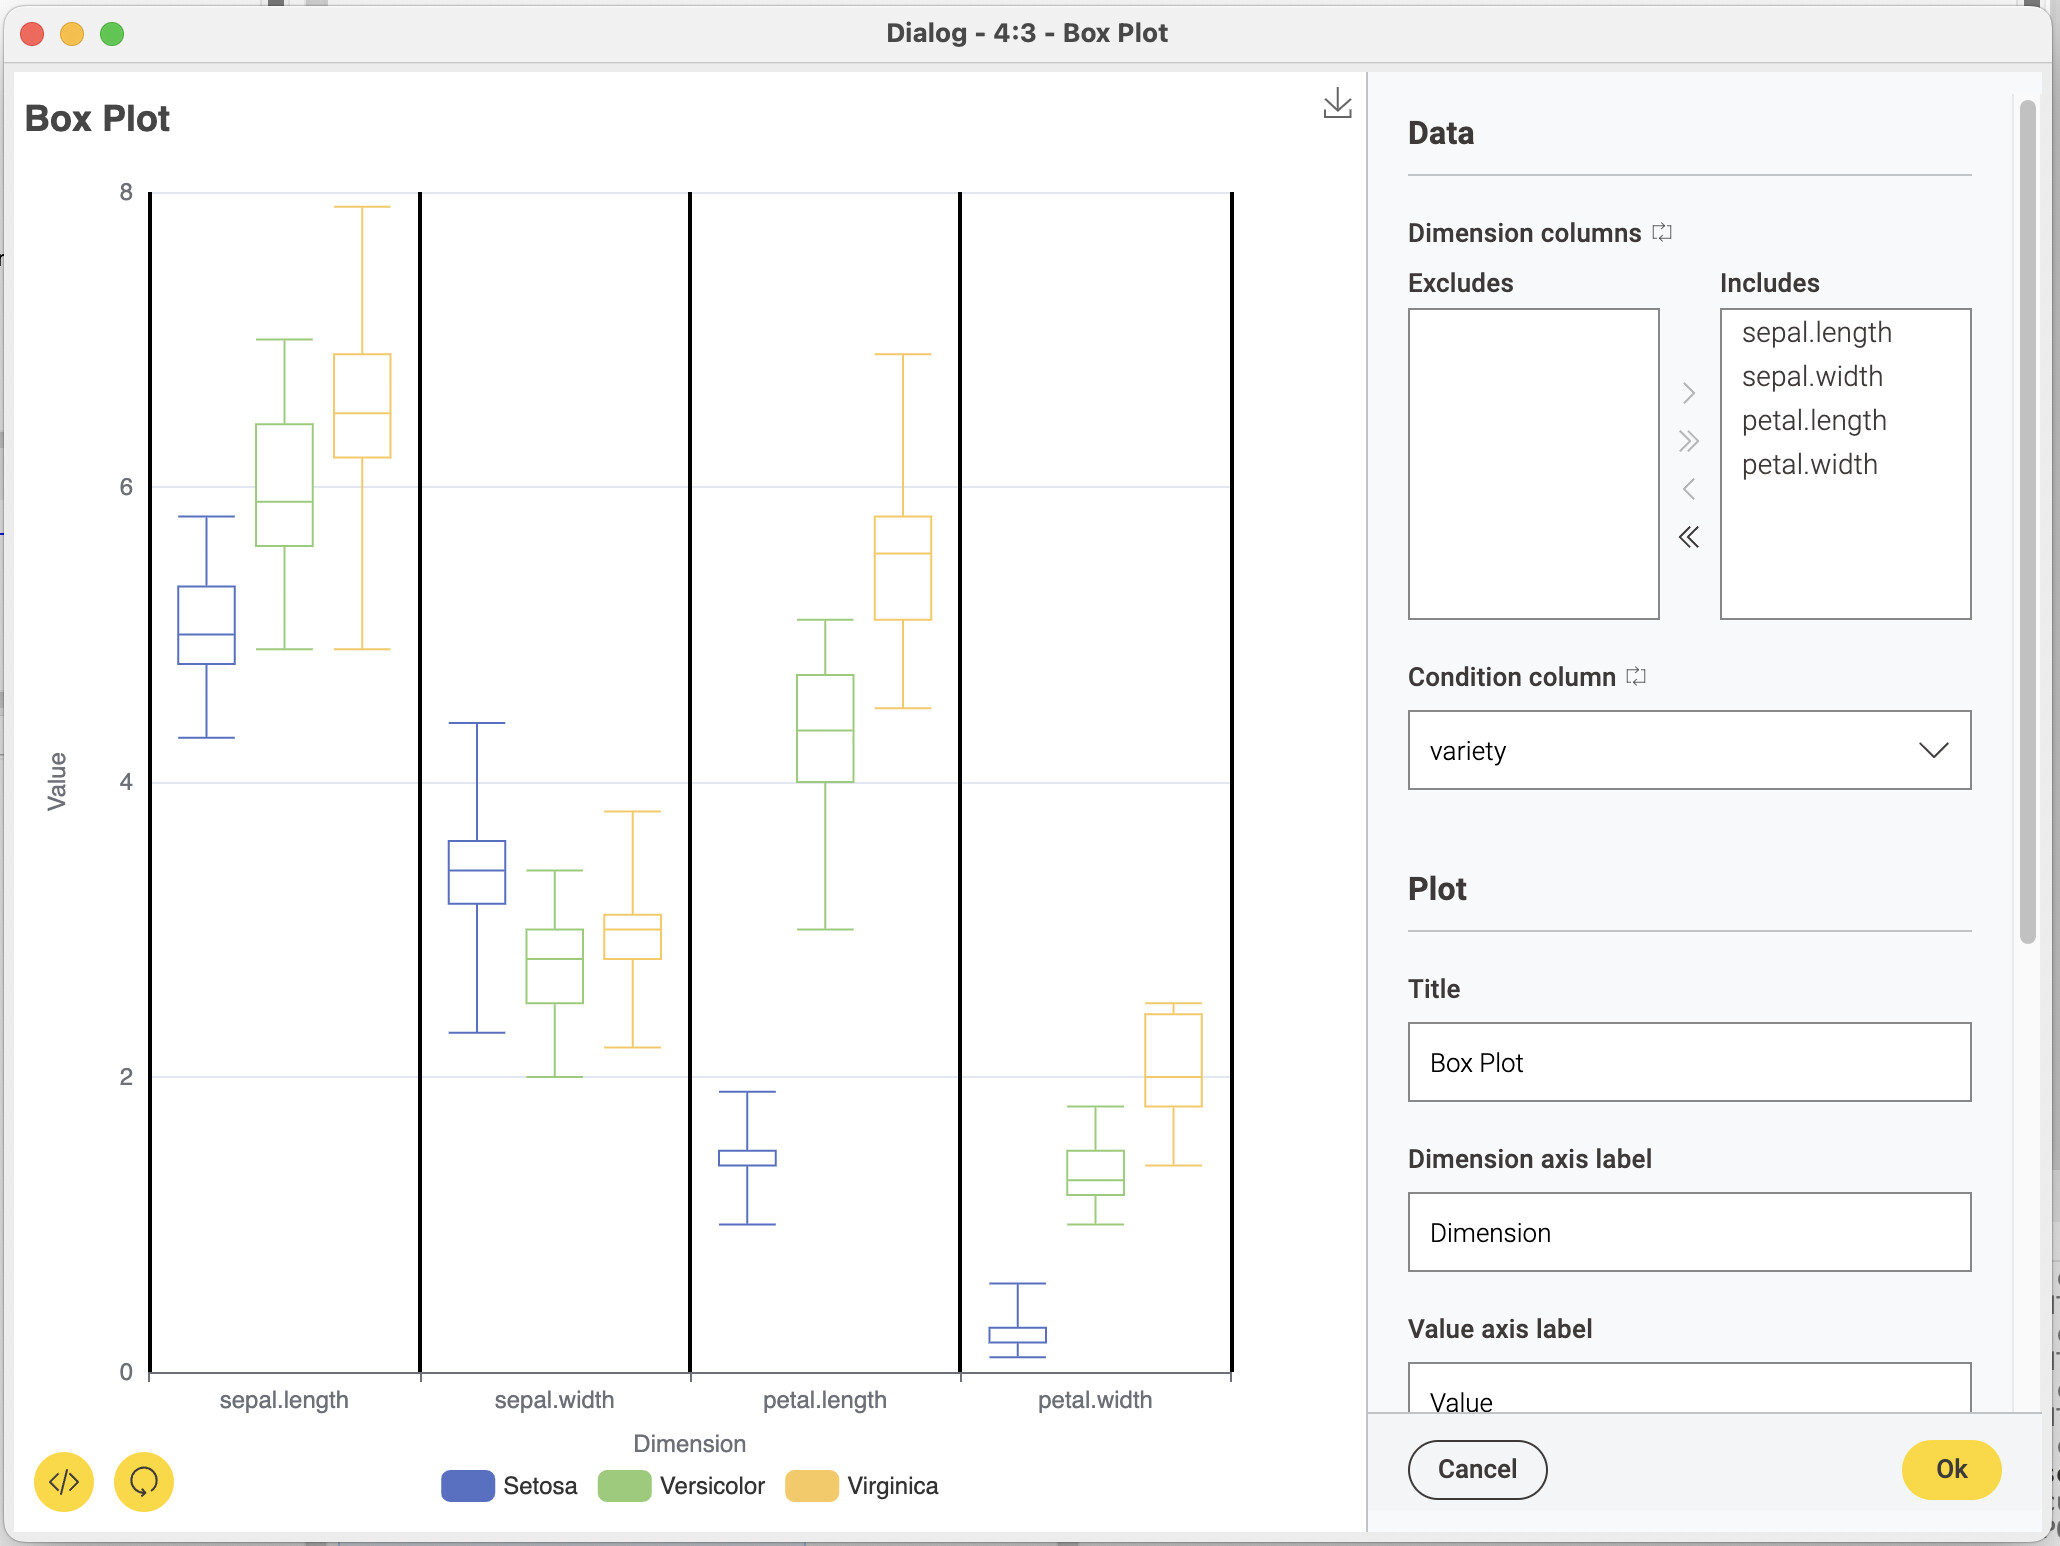
I might have good news for you. We are currently reworking our views and we already re-did the Box Plot. It is now capable of displaying multiple columns. The node is currently only available in the nightly (Nightly build downloads | KNIME) if you have the KNIME Views (Labs) extension (KNIME Views (Labs) – KNIME Hub) installed.
As this is still a labs extension and we are actively developing it at the moment it would be very valuable feedback if this is already sufficient for your use case. We are also happy to receive any other feedback ![]()
Greetings,
Daniel
2 Likes
Hello Daniel, thank you very much for the new node (I tried it out right away, and if I could make a wish, it would be great if the node could also save the graphic automatically as a file. You always have to click manually so that it exports the graphic…)
To my previous request: Is there a small sample workflow on the knime-hub where I could see an automated graphic creation?
Many thanks and greetings
Wolfgang
Hey Wolfgang,
the feature I have mentioned might not be the functionality you are looking for. An example of what meant can be seen in the attached workflow. With this one view you can have BoxPlots for each of the dimensions you have selected.
But I think you want to be able to create an own visualisation for each of these dimensions, correct?
This is currently not possible, but we already received a few requests for this and are looking for a solution to it.
Regarding your wish, we are currently working on exactly this ![]()
Greetings,
Daniel
3 Likes
This topic was automatically closed 90 days after the last reply. New replies are no longer allowed.