Please help a chemist with poor data handling skills ![]()
From my HPLC I get chromatograms exported as csv files as simple X,Y coordinates in two columns. The number of chromatograms varies from day to day depending on how many samples I run, but I always collect them in a new folder. I usually load the csv files into Excel where I normalise the Y axis and then plot all of the chromatograms in one X,Y graph.
It is a bit tedious doing this manually every time so, upon a friend’s recommendation (to avoid vba coding), I tried to get knime to help me do it automatically.
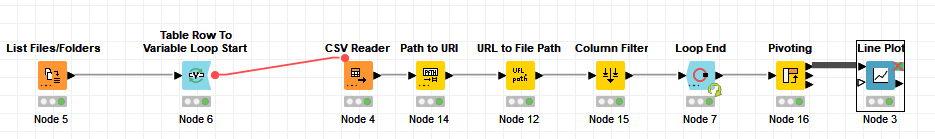
I can get all of it done for one file, but can’t figure out how to do it with multiple files and stack them in the same graph (or output to Excel). I have asked google, ChatGPT and looked on the forum here, but not found a solution that I got to work. I guess that I need some sort of loop, but which one, and how, is not quite clear to me when the amount of csv files in my folder varies and I add an extra column to my original dataset for the normalisation of the data.
I hope my question is clear and that I have not overlooked too many of the same topics here on the hub.
Br,
Anders.